My lecture 2 weeks ago is now hopelessly outdated; thankfully my Rhode Island College students collaborated with me to put together resources that are helpful for understanding the geopolitical issues in the Middle East today.
With a simple class hastag (e.g.-#geog400ric) you can create a backchannel for student to collaborate outside the classroom walls.
Explore the cities and emerging urban clusters that will drive dramatic growth and demographic changes over the next generation. A McKinsey Quarterly Economic Studies article.
In the next 13 years, 600 cities will account for nearly 65 percent of global GDP growth. That is reason enough to explore this global dataset with over 2,600 metropolitan areas.
I saw this video on an Atlantic Cities article and was struck by the rural and “off-the-beaten path” feel that timelapse of the Mother Road manages to capture. Route 66 looms large in Americana, in part because it represents a bygone era, a time when the automobile was new and exciting. This empowered many to make a cross-country road trip, but during this time the car was not so ubiquitous that it was the overwhelming force that is so visually prominent in urban landscapes as it is today. The historical and cultural critique of the U.S. automobile culture in the Pixar movie Cars may be fictional and for a child audience, but it is quite accurate in noting that cities disconnected from the interstate system sharply declined and were never the same. These places represent for many people then, a classic pop culture landscape of yesteryear.
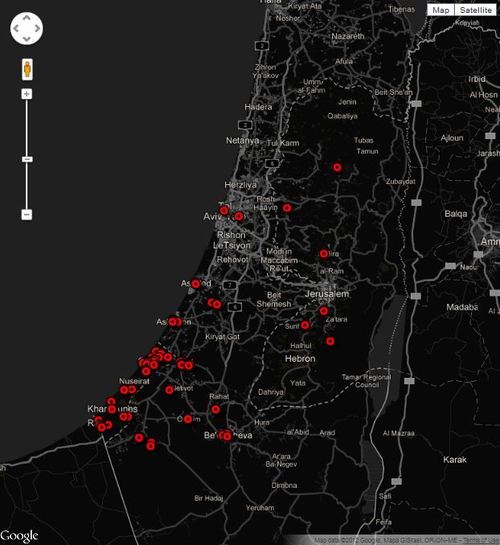
Israeli airstrikes began November 14, following months of Palestinian rocket fire into Israel.
“Monday, the top leader of Hamas dared Israel to launch a ground invasion of Gaza and dismissed diplomatic efforts to broker a cease-fire in the six-day-old conflict, as the Israeli military conducted a new wave of deadly airstrikes which included a second hit on a 15-story building that houses media outlets.” This photo essay shows 34 powerful images that are emerging from this deadly conflict. If students need some background to understand who are the major players in this conflict, this glossary should be helpful.
This map shows each verified incident of violence in Gaza and Israel since last week’s assassination of Hamas leader Ahmed al-Jabari. Geospatial technologies combined with social media are changing how we learn (and wage) war.
Neighborhoods that are perceived by outsiders as economically successful have created a cultural niche that draws in visitors with a mixture of shops and amenities that appeal to a particular demographic…
A vibrant cultural ambiance is not just a backdrop for selling commodities in shopping districts. The feel of a neighborhood and a sense of place can be the commodity as Air BnB is artfully demonstrating.
Want to know where your Thanksgiving food comes from?
This provides the geography of holiday food production with links to the data so you can map out the data with GIS (links produced by Western Illinois University).
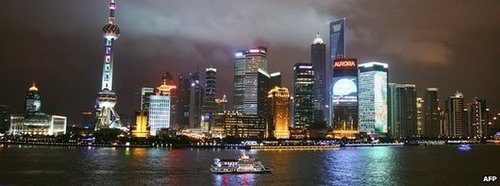
China is simply to important to ignore and this profile is a good primer for students unfamiliar with the East Asian country to get caught up to speed.
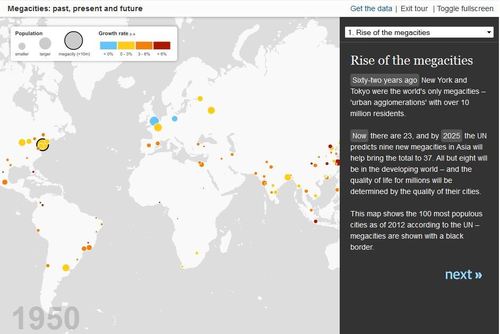
Through this interactive mapping feature with rich call-out boxes, the reader can explore the latest UN estimates and forecasts on the growth of megacities (urban areas with over 10 million residents). These ‘cities on steroids’ have been growing tremendously since the 1950s and present a unique set of geographic challenges and opportunities for their residents.
Download the data yourself as a CSV file and your can import this into ArcGIS online and symbolize your map with any of the columns in the dataset.