“Texas, Florida and North Carolina are among the states that will gain congressional seats based on new population data from the U.S. census, a shift that could boost Republican chances of recapturing the U.S. House of Representatives from Democrats in next year’s midterm elections. The overall U.S. population stood at 331,449,281, the Census Bureau said on Monday, a 7.4% increase over 2010 representing the second-slowest growth of any decade in history. The release of the data, delayed for months due to the coronavirus pandemic, sets the stage for a battle over redistricting that could reshape political power in Washington during the next decade. States use the numbers and other census data to redraw electoral maps based on where people have moved.” SOURCE: Reuters
It is constitutionally mandated that the U.S. government conduct a census every ten years. There are many benefits for all that data, but the original purpose was to allot congressional seats in the House of Representatives. Today the number is locked in at 435, so as states’ populations grow or (relative to others) shrink, a given state many gain or lose seats in the House. This ends up being very consequential, especially in a two-party country that is pretty evenly divided.
New York and California (two of the largest states with the most seats) are the most upset since they are seeing their relative political power in the House of Representatives wane for the first time in decades while Texas is smiling big with 2 added seats. Little Rhode Island is letting out a huge sigh of relief, since it was projected that Rhode Island would be losing 1 of their 2 congressional seats along with federal funding that is attached to that seat. However, Rhode Island managed to retain their two seats. The census only says how many seats a given state will have, but it is up to the state government to reapportion the districts. Redistricting can be very contentious and when it gets overtly and unfairly partisan, that’s when regular old redistricting can become gerrymandering.
Things to Consider: What demographic shifts have led to these new political patterns on the map? Will these shifts lead to gerrymandering? How will this impact the states gaining (or losing) seats?
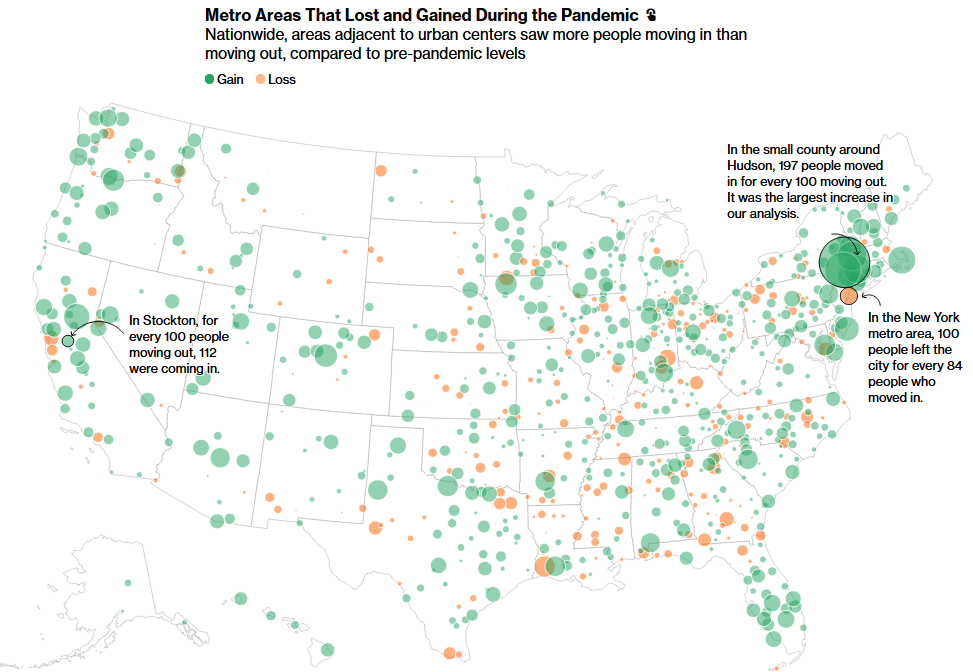
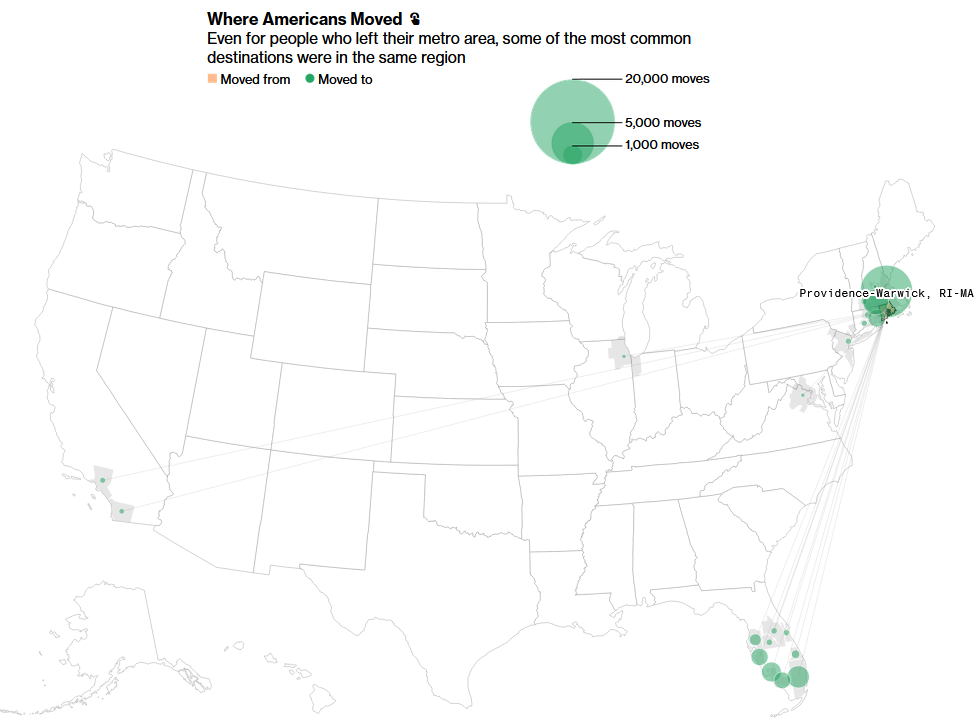
“A year into the Covid-19 pandemic, after much speculation about emptied downtowns and the prospect of remote work, the clearest picture yet is emerging about how people moved. There is no urban exodus; perhaps it’s more of an urban shuffle. Despite talk of mass moves to Florida and Texas, data shows most people who did move stayed close to where they came from—although Sun Belt regions that were popular even before the pandemic did see gains.” SOURCE: Bloomberg’s CityLab
A year ago, some of the most dire warnings about COVID-19 related migration pointed to the collapse of major metropolitan centers and an existential threat to urbanization as we know it. True, high density settlements have been heavily impacted but the fears that New York City would cease to be “The City” were a bit overstated.
Outside of NYC and the Bay Area, most of the migration inside the United States has been WITHIN metropolitan statistical areas, and usually from the more dense core to the outer fringe. So edge cities, suburbs, exurbs, and micropolitan areas have seen an increase, but many of these moves were simply accelerated by the pandemic. The interactive charts and maps are what make this article an exceptional teaching resource.
Questions to Ponder: How has your area’s demographic profile changed during the pandemic? What are the areas of your state that have been most heavily impacted? When people move from your county, where do they go? Where do migrants into your county come from? What patterns do you see and what explains these patterns? What push and pull factors influence these choices?
While I try to keep things nonpartisan, sometimes objective truths become partisan issues, and often the study of human geography can improve our collective political dialog. Department of Transportation, Pete Buttigieg (a.k.a. Mayor Pete) said “there is racism physically built into some of our highways.” Online detractors noted that rebar, concrete, and asphalt can’t be racist, etc. You see the over-literal interpretation, but I want to discuss his bigger point—how has racism shaped the building of infrastructure and urban landscapes?
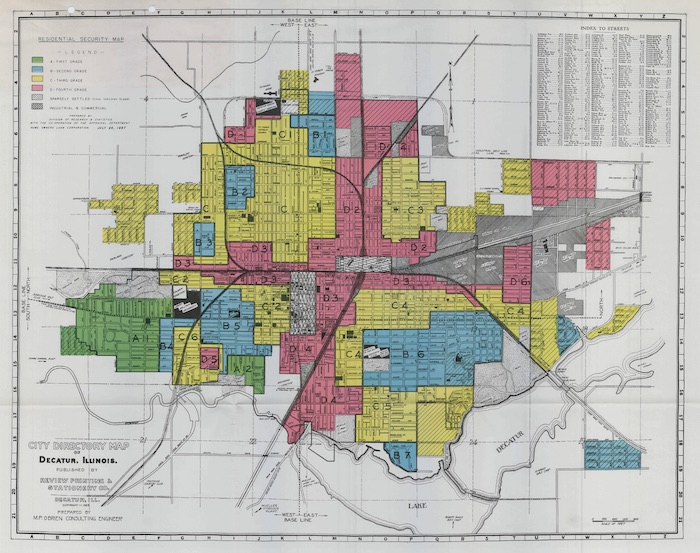
The term redlining has a specific definition and a broader application. First, the narrower definition; redlining was a historical practice in the early to mid-20th century where banks and other decision-makers used city maps that marked low-income neighborhoods (pre-dominantly African American), and would deny potential home-owners’ loans to purchase in these neighborhoods. In an era of legalized segregation, African Americans were in a bind; they could not move into the white neighborhoods, but they could not get loans to purchase a home in their own neighborhood. The maps literally used a red line to mark the neighborhoods where the banks would not provide any home-lending services to the residents. Explore this fantastic interactive map, Mapping Inequality: Redlining in New Deal America. You can use this to find redlining close to your home, or the city where I teach, Providence, RI.
1929 Home Owners Loan Corporation Map of Decatur, IL.
More broadly speaking, redlining is not just about the denial of home loans. Many practices such as this meant African Americans in the United States could not get access to the full range of services, utilities, resources, and planning to see improvements in their neighborhoods.
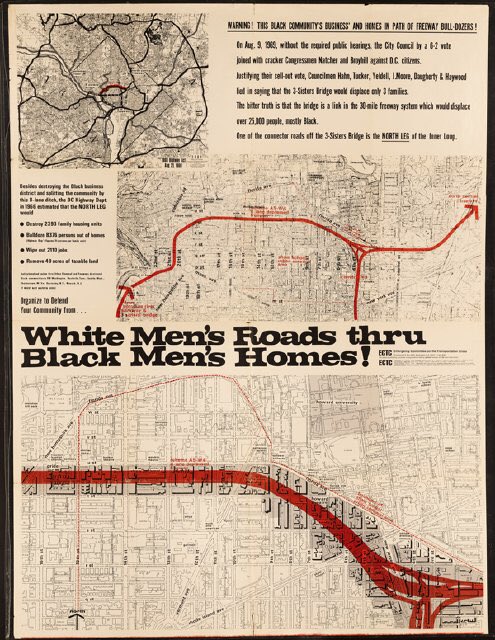
The era of redlining also coincided with the era of the private automobile and the beginning of large freeways on the American landscape. The major freeways in urban centers weren’t placed on conveniently open spaces, but by tearing down (typically) poor neighborhoods that had less of a political voice. This happened in African American neighborhoods in Baltimore, Oakland, New York, Detroit, Cincinnati…the list is far too long. Read this piece in the Guardian for some images and examples.
A poster against the creation of proposed highway in Washington DC. Source: DC History
So, when Mayor Pete says that “there is racism physically built into some of our highways,” he means it, and it’s a part of our historical geography. The road itself might not be racist, but the institutions that plowed through poor Black neighborhoods is, and leaves a legacy on the built environment. Redlining is obviously illegal today, but the neighborhoods they shaped, divided by railroad tracks or highways or both, these communities are still impacted by the policies of yesteryear.
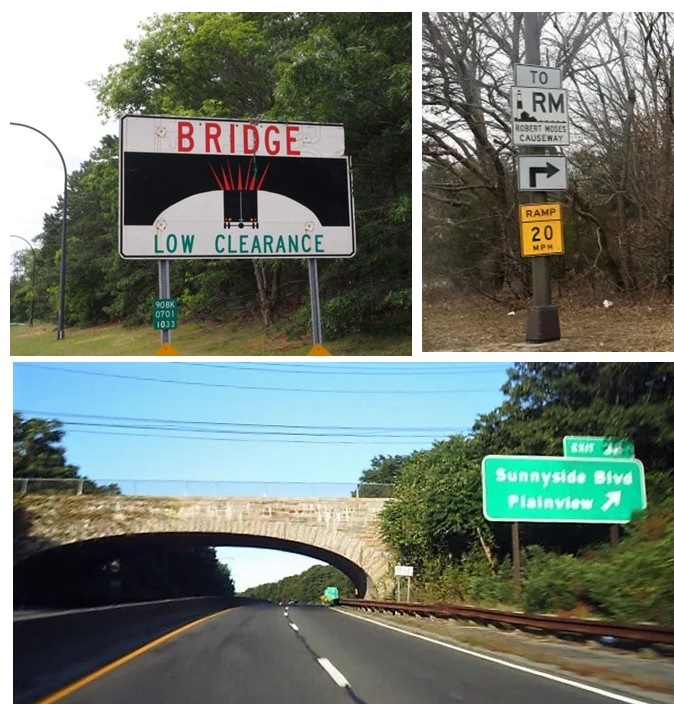
For generations, New York City urbanists have adored Jane Jacobs as the champion for local communities and her opposition to the soulless, neighborhood-destroying urban planner, Robert Moses. This is partially true, if simplistic, because hating one individual (Robert Moses) for inserting oppressive elements into the landscape misses the bigger point that he was simply in charge of the system, and if it weren’t for him, there would have been another to take his place. Let’s use one famous NYC, Robert Moses example of racism in the built landscape:
Images from Long Island, showing bridge overpasses that limit public transportation to beaches.
Action: Robert Moses designed Long Island bridges and highways with low overpasses.
Result: Long Island beaches are inaccessible through mass transit.
Purpose: Limit access of NYC poor from the affluent beaches of Long Island.
What are the implications of these facts? One instance of this type of infrastructural planning might be a coincidence rather than a sign of racial bias, or class-based bias, but the preponderance of evidence across the country from this era leads to the obvious conclusion that U.S. infrastructure, especially the highways, were shaped by racist policies that continue to have racial impacts. The evidence is there; for any honest observer, the conclusion that racism shaped U.S. infrastructure is not controversial.
Examine examples in your own community to see how these practices have shaped your local neighborhoods. Once you’ve seen how your community has been shaped, look at at other examples across the U.S. to see that your neighborhood is a part of a broader spatial pattern that shows how racism has shaped U.S. infrastructure.
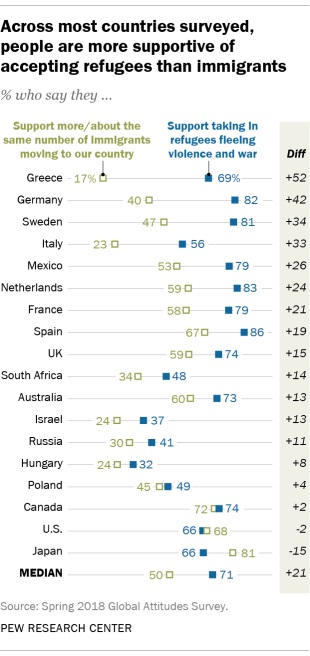
“On balance, people around the world are more accepting of refugees fleeing violence and war than they are of immigrants moving to their country, according to a new analysis of public opinion data from 18 nations surveyed by Pew Research Center in spring 2018.” SOURCE: Pew Research Center
We know that there are diverse perspectives on migration in our own country, but it is important to remember that our country’s conversation is also a part of a global conversation. As many developed countries are trying to limit some of the permeability of their borders, and as economic migrants seek to improve their economic opportunities, the immigration debates become more central to Since there has been As the Pew Research data shows, in North America, the immigration discussion and the refugee discussion have converged, where in countries such as Greece they are very much different conversations.
Questions to Ponder:
Why might the immigration and refugee assistance questions elicit a greater distinction in European countries (such as Germany, Italy, and Greece) then it did in North American countries (such as the U.S. and Canada)?
What are some impacts of the convergence of the political conversations surrounding immigration and refugee assistance for the United States and its policies?
% who support taking in refugees:
🇪🇸 ESP 86%
🇳🇱 NED 83
🇩🇪 GER 82
🇸🇪 SWE 81
🇫🇷 FRA 79
🇲🇽 MEX 79
🇨🇦 CAN 74
🇬🇧 UK 74
🇦🇺 AUS 73
🇬🇷 GRE 69
🇯🇵 JAP 66
🇺🇸 US 66
🇮🇹 ITA 56
🇵🇱 POL 49
🇿🇦 SA 48
🇷🇺 RUS 41
🇮🇱 ISR 37
🇭🇺 HUN 32https://t.co/8yTIWXgRRi
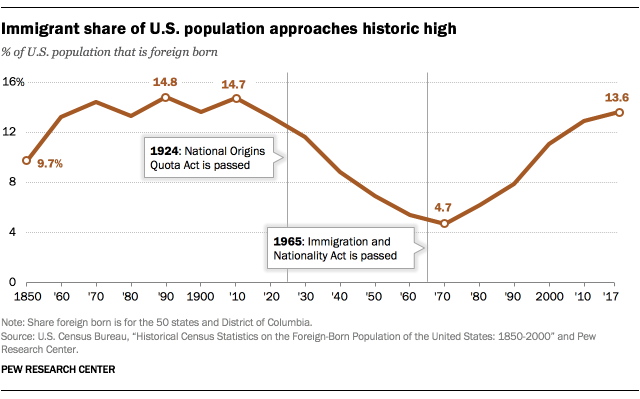
” Nearly 14% of the U.S. population was born in another country, numbering more than 44 million people in 2017, according to a Pew Research Center analysis of the U.S. Census Bureau’s American Community Survey. This was the highest share of foreign-born people in the United States since 1910, when immigrants accounted for 14.7% of the American population. The record share was 14.8% in 1890, when 9.2 million immigrants lived in the United States.” Source: Pew Research
The percentage of residents in the United States that are migrants (born in a country other than the United States) has been rising since the 1970. This is much higher than the global average of 3.4%, but not surprising given how economic pull factors are reshaping global demographic patterns. High-income countries attract more migrants; so the demographic impact on the global patterns of migrants is profound. High-income countries have 14.1% of their residents coming from other countries, where middle and low-income countries average between 1 and 2% for their percentage of migrants in their populations.
Questions to Ponder: What are some of the demographic, economic, cultural, and political impacts of these statistics? How might this impact certain regions?
This op-ed looks at the demographic trends of Japan’s declining population and tries to see what this might mean for the United States.
Questions to Ponder: What are the cultural and economic forces that lead to a declining population? What are some of the difficulties that confront countries with declining populations?
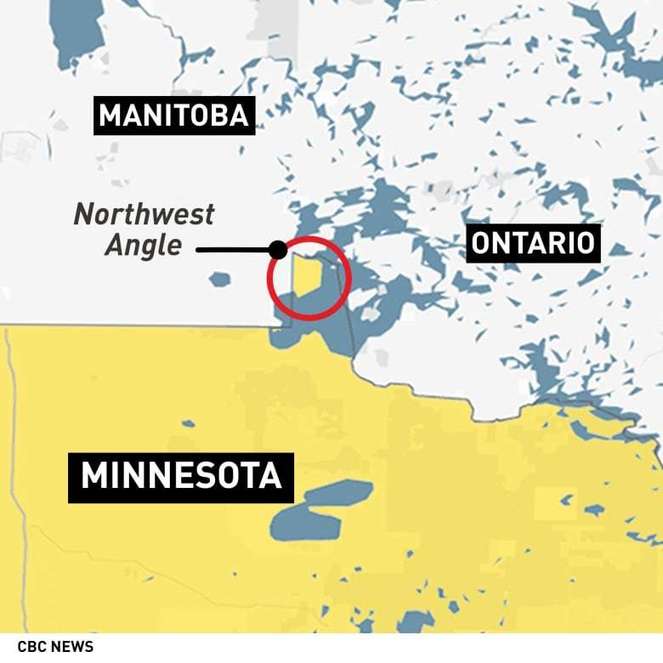
"There’s a petition that calls for the United States government to adjust the border near Manitoba to give Canada the geographic oddity known as the Northwest Angle."
Enclaves and exclaves are often bizarre examples that test the normal rules regarding the political organization of space. Historical quirks, landform oddities, competing national goals, and irregular demographic patterns mean that the world is filled strange little case studies about places that seem to defy our normal expectations. However, the most enduring rule seems to be this: never voluntarily give up territory that you can easily control.
This set of 15 maps on how land is used in the 48 contiguous U.S. states is a phenomenal resource to visualize how we use our land (admittedly this does exclude Alaska and Hawaii, but given that Alaska’s land use patterns can skew the patterns considerably). This is especially useful in agricultural units, but has many other applications.
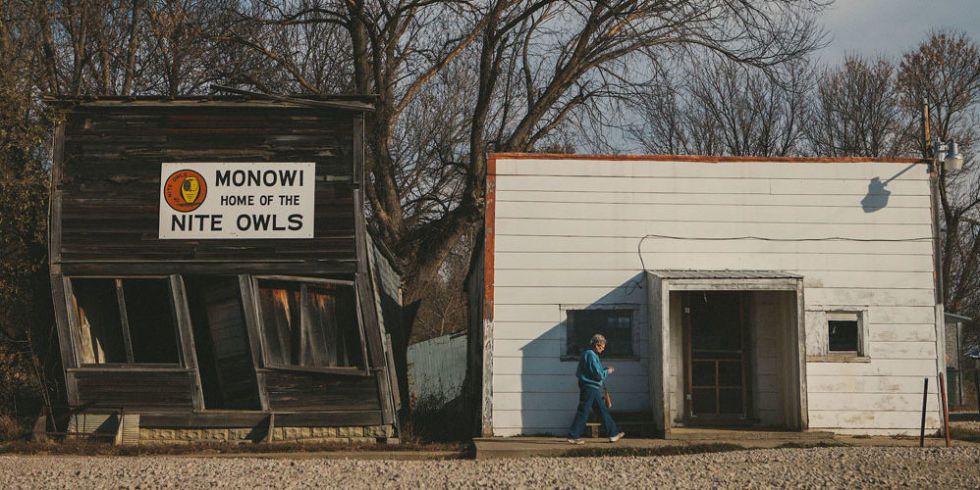
What is it like living in a town with a population of 1? Would you stay as the last remnant of your withering town? This case study is absolutely fascinating since it defies what we consider the minimum threshold of what is required for a city or a town. However, the other compelling geographic story is how a once, low-order central place in rural Nebraska, has been (almost) completely abandoned.