Search

GEOGRAPHY EDUCATION

Supporting geography educators everywhere with current digital resources.

Tag

climate change

Concrete: the most destructive material on Earth

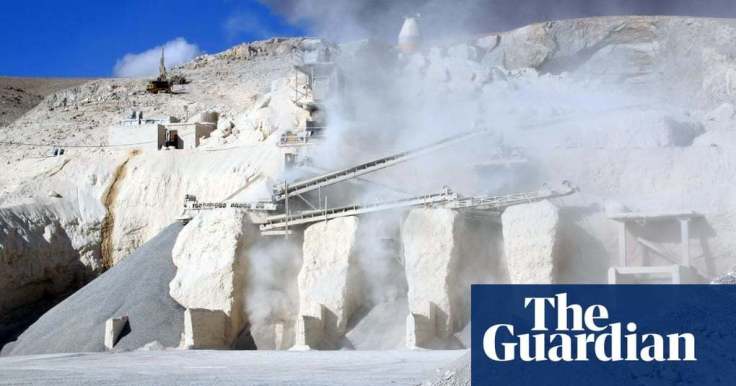
“After water, concrete is the most widely used substance on the planet. But its benefits mask enormous dangers to the planet, to human health – and to culture itself. Our blue and green world is becoming greyer by the second. If the cement industry were a country, it would be the third largest carbon dioxide emitter in the world with up to 2.8bn tonnes.”

GeoEd Tags: industry, sustainability, consumption, climate change, environment, architecture, resources.

Scoop.it Tags: industry, sustainability, consumption, climate change, environment, resources.

Source: www.theguardian.com

Borders and the Arctic Ocean

The ice in the Arctic is disappearing. Melting Arctic ice means new economic opportunities: trade routes in the Arctic ocean, and access to natural resources. Because of this, the Arctic nations are now moving to expand their border claims. Russia has shown that it’s the most ambitious, using a potent combination of soft power and military buildup to advance its agenda. They’ve said the Arctic is rightfully theirs.

Source: www.youtube.com

This video is the second video in “Vox borders” series that is shaping up to be an excellent resources for geography educators.  This focus is on Svalbard and Russia’s designs within the Arctic, but this TestTube episode is a shorter version that emphasizes how receding summer ice is being seen as an economic opportunity for all maritime claims in the Arctic.  Canada, the U.S., Russia, and Denmark (Greenland) all are subtly expanding their maritime claims.


Questions to Ponder: How do borders impact the develop/preservation of the Arctic?  How should uninhabited lands and waters be administered politically?


Mapping Coastal Flood Risk Lags Behind Sea Level Rise

Federal maps help determine who on the coast must buy flood insurance, but many don’t include the latest data. Maryland is now making its own flood maps, so homeowners can see if they’re at risk.

Source: www.npr.org

Geographic themes are overflowing (it was an unintended pun, but I’ll just let that wash over you) in this podcast.  I suggest playing a game early in the year/semester called “find the geography.”  What geographic theme/content areas will your students find in this podcast? 


Tagspodcast, mapping, cartography, climate change, environment, watercoastal,  urban, planningurban ecology.

The Fallacy of Endless Economic Growth

What economists around the world get wrong about the future.


The idea that economic growth can continue forever on a finite planet is the unifying faith of industrial civilization. That it is nonsensical in the extreme, a deluded fantasy, doesn’t appear to bother us. We hear the holy truth in the decrees of elected officials, in the laments of economists about flagging GDP, in the authoritative pages of opinion, in the whirligig of advertising, at the World Bank and on Wall Street, in the prospectuses of globe-spanning corporations and in the halls of the smallest small-town chambers of commerce. Growth is sacrosanct. Growth will bring jobs and income, which allow us entry into the state of grace known as affluence, which permits us to consume more, providing more jobs for more people producing more goods and services so that the all-mighty economy can continue to grow. “Growth is our idol, our golden calf,” Herman Daly, an economist known for his anti-growth heresies, told me recently.


Tagsop-ed, economicindustry, sustainability, development, consumption, climate change, environment, resources.


Source: psmag.com

As Climate Change Accelerates, Floating Cities Look Like Less of a Pipe Dream

A costly plan to build floating islands shows how climate change is pushing the search for innovative solutions, but some critics ask who will ultimately benefit.

Source: www.nytimes.com

As coastal communities are considering what the tangible impacts of climate change might be, things that were once considered science fiction could be a part of how people adapt to the modifications we’ve collectively made to our global environment that we depend on to sustain life.  


Tags: physicaltechnologysustainability, climate change, environment, resources, watercoastal, environment dependenvironment adapt, environment modify.

WORKSHEETS: Climate Migrants

“The ESRI storymap on climate refugees does a phenomenal job sampling locations in the world that experience migration effects as a result of climate change. Attached is a guided worksheet that accompanies the ESRI Climate Migrant Storymap.”

Source: www.thehumanimprint.com

This StoryMap shows some key regions where migrants are fleeing some of the negative impacts of climate change and one APHG teacher has created a fabulous worksheet to guide students through this great resource.   


TagsAPHG, climate changemigrationrefugees, environment, coastalmappingESRIStoryMap, political ecology.

Climate Migrants

Climate change has already displaced tens of thousands of people. If it continues unabated, it could lead to one of the largest mass human migrations in history.

Source: storymaps.esri.com

This StoryMap shows some key regions where migrants are fleeing some of the negative impacts of climate change, a trend that appears very likely to increase in the future.  It is also an excellent example of the ESRI’s new Cascade template for creating a web app. 


Tags: physical, weather and climate, climate change, environment, resources, watercoastalmappingESRIStoryMap, visualization, environment depend, political ecology.

Earth Temperature Timeline

Source: xkcd.com

This infographic is a fascinating way to put into context the very recent trend of rising global temperatures.  This is worth scrolling all the way through to make the ending all the more meaningful.  Oh yeah, and August 2016 was the hottest month in recorded history…only 11 months of record-breaking temperatures.  


TagsXKCD, artinfographic, physicalhistorical, environment, climate change.

Surging Seas Interactive Map

Global warming has raised global sea level about 8″ since 1880, and the rate of rise is accelerating. Rising seas dramatically increase the odds of damaging floods from storm surges.

Source: sealevel.climatecentral.org

This interactive map from Climate Central dramatically shows what locations are most vulnerable to sea level rise.  You can adjust the map to display anywhere from 1 to 10 feet of sea level rise to compare the impact to coastal communities.  This dynamic map lets to view other layers to contextualize potential sea level rise by toggling on layers that include, population density, ethnicity, income, property and social vulnerability.   


Tags: physical, weather and climate, climate change, environment, resources, watercoastalmapping, visualization, environment depend, political ecology.

Create a free website or blog at WordPress.com.

Up ↑