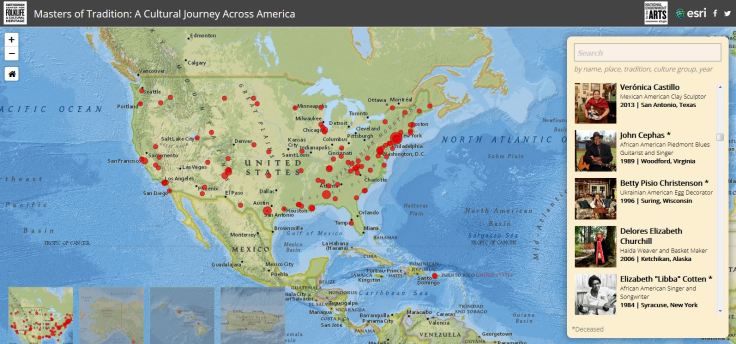
Search

GEOGRAPHY EDUCATION

Supporting geography educators everywhere with current digital resources.

Tag

storymap

Masters of Tradition: A Cultural Journey Across America

NEA Map

Explore the Masters of Tradition story map. Discover the rich diversity of cultures and artistic traditions that enliven our nation. Meet extraordinary artists from across the country who have been awarded the National Endowment for the Arts National Heritage Fellowship, the nation’s highest honor for excellence in the folk and traditional arts. Together they represent a remarkable portrait of America’s diverse cultural heritage.” SOURCE: ESRI

This is an excellent StoryMap that to shows examples of local and indigenous cultures that are being practiced by some in the United States.  The NEA Fellowship also shows how preserving local and indigenous cultural traits in the face of popular cultural influences is difficult and is seen as a national priority and part of a treasured cultural heritage.  This is a good article on how to plan a good storymap.

Excellent Examples using the Map Tour template:

  1. Ancient Worlds of the World
  2. New Wonders of the World
  3. Visit Palm Springs
  4. A Gallery of other examples

GeoEd Tags: indigenous, culture, esri, storymap.


Connecticut’s Changing Landscape

“Changing Landscape is a remote sensing-based land cover study that charts landscape changes in Connecticut and portions of New York. It covers the 25-year period from 1985 to 2010 (with in-between dates of 1990, 1995, 2002 and 2006). It includes information on basic land cover, as well as subsidiary analyses of riparian corridor land cover, impervious cover and agricultural field and soil analysis.”

Source: clear3.uconn.edu

This story map, created with the Story Map Journal application in ArcGIS Online, is a great example of how to use the “Story Action” features.  Story Action features can move the map view to a particular location or change what is being displayed on the main stage of the story map.  These can also be used to navigate to a different section of the a story map.

Here are two excellent Story Maps that use “Story Action” features.  Please take some time to explore both of them and note how these features enhance the presentation of this spatial information:

  1. Connecticut’s Changing Landscape
  2. Damaged and Defiant: Houston Stories
  3. And just for fun, the Cross-Section of elevation along the meridians.

GeoEd TAGS: urban ecology, mapping, esri, storymap.

Damaged and defiant: Hurricane Harvey

Houston holds strong in the wake of devastation left by Hurricane Harvey.

Source: www.houstonchronicle.com

I am sharing these three interactive webmaps of Houston with my mapping courses to demonstrate what is technologically possible.  Texts, charts, pictures, videos, and maps can be seamlessly integrated to present spatial information in an incredibly engaging and accessible manner.  

Houston’s Hurricane Harvey was incredibly impactful but the factors leading to this were also very complex.  These three Story maps lay out:

  1. Houston’s urban ecological context
  2. The geographic origins of Hurricane Harvey
  3. The human stories from Hurricane Harvey


Scoop.it Tagsphysical, watercoastal, urbanurban ecology, disasters, mappingESRIStoryMap.

WordPress TAGS: physical, water, coastal, urban, urban ecology, disasters, mapping, esri, storymap.

Houston’s stories of Hurricane Harvey

“Blue and her team selected 45 stories, each plotted with ESRI’s ArcGIS software on a map of Greater Houston and tied to the exact location where it was first told. The resulting story map of Hurricane Harvey, ‘Damaged and Defiant: Houston Stories,’ was published in the Houston Chronicle in December. The map shows short narratives gathered by Chronicle staffers from people across the area — from Crosby to Kingwood to Katy — each a unique perspective on the storm; told together, they’re the collective account of a city that experienced one of the worst natural disasters in U.S. history.”

Source: news.rice.edu

These interlinked Houston story maps show some of the key elements of a good story map: 1) strong spatial analytical components, 2) a powerful narrative, 3) rich visuals, 4) solid cartography, and 5) well-sourced information.


Tags: fluvialwatercoastal, urban, disasters, physical, mappingESRIStoryMap.

The Two Koreas

“While the Korean War of the early 1950s never formally ended, its aftermath has created starkly divergent worlds for those living on either side of the north-south divide. What follows is a look at life in the two Koreas; how such a night-and-day difference came to be; and where the crisis could go from here. Both governments claimed to be the legitimate rulers of the peninsula. Tensions between north and south gradually mounted, until finally, in June 1950, hundreds of thousands of North Korean troops stormed across the 38th parallel. The unsuspecting South Korean defenders were outgunned and outnumbered, and beat a hasty retreat southward.”

Source: storymaps.esri.com

This excellent interactive was created by Esri’s Story Maps team using the Story Map Cascade app–making it an great resources of the geography of the Korean Peninsula as well as a stellar example of how maps, infographics, videos, images and text can be combined using ArcGIS online.


Tags: mappingESRIStoryMapinfographic, visualizationNorth KoreaSouth Korea, East Asiaborders, political, geopolitics, historical.

Story Map Swipe and Spyglass Gallery

“The Story Map Swipe and Spyglass app template enables users to interact with two web maps or two layers of a single web map, depending on how you build your story. The app enables you to present a single view, or to develop a narrative showing a series of locations or views of the same maps.”

Source: storymaps.arcgis.com

The ESRI template to create swipe and spyglass feature is an engaging way to compare and contrast two data layers. For the SPYGLASS maps, I’ve always enjoyed this historical interactive of Chicago. Chicago is displaced during a economic boom period as the U.S. was expanding westward.  Where were the railroads located then?  Why have some of them vanished today?  Notice anything curious about the coastline along Lake Michigan?  Follow this link to see similar interactives of other major U.S. cities.

For the SWIPE maps, I love exploring this one showing how human activities has reshaped the physical environment.  What activities are creating the new patterns that you see?


Tags: historical, mappingESRIStoryMap.

How Does the U.S. Census Bureau Define Rural?

“The U.S. Census Bureau has designed a multimedia application experience, a story map, called ‘Rural America: How Does the U.S. Census Bureau Define Rural?’ This story map contains interactive web maps, tables, information, and images to help explain how the Census Bureau defines ‘rural.’ Many rural communities rely on American Community Survey (ACS) 5-year estimates, rather than ACS 1-year estimates, because of population thresholds. This story map helps data users understand the history and definition of ‘rural.’ Watch this video and then visit the story map to learn more.” Visit the Story Map: http://go.usa.gov/x8yPZ  

Source: www.youtube.com

Census geography brings statistical data to life as seen in their newly designed interactive story map, called “Rural America: How Does the U.S. Census Bureau Define ‘Rural?” Not only does this story map helps explain how the Census Bureau defines rural, but it displays some fantastic data that helps students to explore rural America.  Many APHG teachers refer to unit 5 as the “ag unit” but the full title, Agriculture, food production, and rural land use, certainly does highlight why this can be a valuable resource.  


Tags: rural, census, regions, mappingESRIStoryMap.

Enclaves & Exclaves

A tour of the world’s engulfed and orphaned places.

Source: storymaps.esri.com

This storymap is a full length article about all the intricacies about enclaves and exclaves, but the interactive format, visuals and maps really make this much more than another article on the topic.    


Tags: borders, political, mappingESRIStoryMap.

What can I do with a Geography Degree?

“While it is easy to understand getting excited about maps, different cultures and environments, and even being better citizens through geography, it is harder to see how geographic knowledge can lead to good jobs or meaningful careers. In recent years, people have discovered that large numbers of societal problems have geographic dimensions, and that education and training in geography provides essential skills and knowledge for real-world problem solving. As a result, geography has become a necessary ingredient in hundreds of different jobs. This assortment of careers helps demonstrate the wide array of employment opportunities that exist for graduates with education in the field of geography. Within this publication, careers are divided into a number of different employment categories, including:

  • ​Geography Education
  • Environmental Geography
  • Geospatial Technologies
  • Land Use Planning

Source: tage.maps.arcgis.com

Many students enjoy geography classes but aren’t sure about what they can do with this geography degree.  This StoryMap from the Texas Alliance for Geographic Education is an excellent resource.  Additionally, the American Association of Geographers career page is a phenomenal resource.   


TagseducationESRIStoryMap, geography, geography education.

Create a free website or blog at WordPress.com.

Up ↑