Search

GEOGRAPHY EDUCATION

Supporting geography educators everywhere with current digital resources.

Tag

remote sensing

GFPLAIN250m, a global high-resolution dataset of Earth’s floodplains

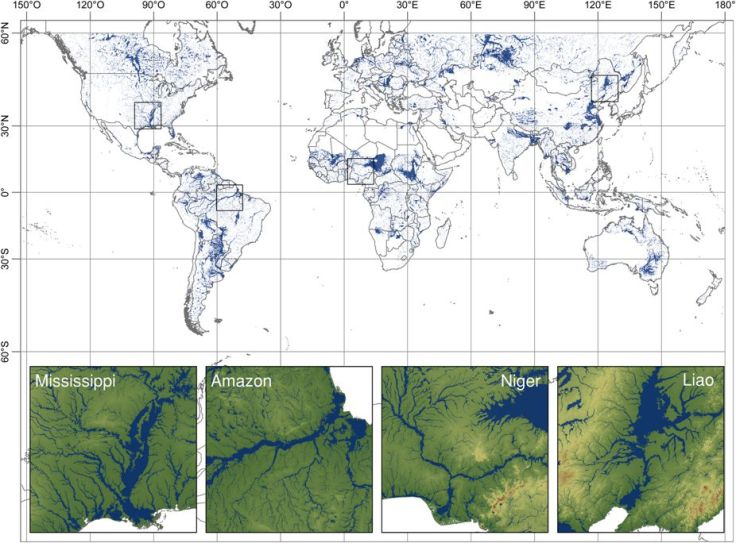
Identifying floodplain boundaries is of paramount importance for earth, environmental and socioeconomic studies addressing riverine risk and resource management. However, to date, a global floodplain delineation using a homogeneous procedure has not been constructed. In this paper, we present the first, comprehensive, high-resolution, gridded dataset of Earth’s floodplains at 250-m resolution (GFPLAIN250m).

Source: www.nature.com

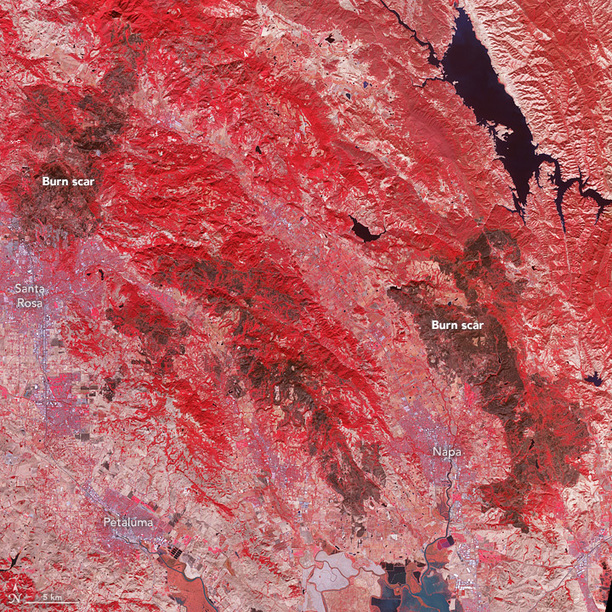
Satellites see the world as a bunch of pixels.  In this recent article in the journal Nature, the authors used a global set of satellite images to create the first global layer of floodplains.  This data is now publicly accessible as a free download (one you can put into ArcGIS after the files are extracted and zipped).     


GeoEd Tags: mapping, ESRI, GIS, remote sensing.

Scoop.it Tags: mapping, ESRI, GIS, remote sensing.

Five Tips and Strategies on How to Interpret a Satellite Image

What do you do when presented with a new satellite image? Here’s what the Earth Observatory team does to understand the view.

  1. Look for a scale
  2. Look for patterns, shapes, and textures
  3. Define the colors (including shadows)
  4. Find north
  5. Consider your prior knowledge

Question #2: READ TO ANSWER FOR MORE INFO ON THE FIVE TIPS: earthobservatory.nasa.gov

Question #3: Also search through NASA’s Earth Observatory (Images or Articles) and the Jefferson Grid Instagram account.

Aerial photography can be quite beautiful, as can satellite imagery. These are more than just pretty pictures; interpreting aerial photography and satellite imagery is not easy; here is a great article that gives an introduction on how to interpret satellite imagery. With a little training, satellite images become rich data sources (instead of some visually meaningless data).  Using Stratocam, you can explore and tag some of the amazing place on Earth. 

Tags: mapping, perspective, remote sensing, geospatial, unit 1 Geoprinciples.

See the Strange, Beautiful Landscapes Revealed by Lasers

“Geospatial technologies unearth a world hidden beneath the lush forests of the Pacific Northwest.”


If you were to strip a forest of all its vegetation, what would you see? To find out, Washington state’s government is using airplanes equipped with LIDAR technology to scan the state’s heavily-forested ground. What’s being revealed beneath the trees is a spectacular and strange landscape of hidden geology. Old landslides, abandoned river channels, ancient lava flows, and the tracks of glaciers are suddenly visible in stark relief. Tracking the altitude and location of a plane with GPS while it scans the ground with LIDAR yields a highly precise digital elevation map of the Earth’s surface created out of the billions of laser pulses. By uncovering the debris from old landslides, LIDAR can show where future slides may occur.


Tags: geomorphologyremote sensing, geology, physical.

Source: news.nationalgeographic.com

Maya civilization was much vaster than known, thousands of newly discovered structures reveal

Scientists using high-tech, airplane-based lidar mapping tools have discovered tens of thousands of structures constructed by the Maya.


Archaeologists have spent more than a century traipsing through the Guatemalan jungle, Indiana Jones-style, searching through dense vegetation to learn what they could about the Maya civilization. Scientists using high-tech, airplane-based lidar mapping tools have discovered tens of thousands of structures constructed by the Maya: defense works, houses, buildings, industrial-size agricultural fields, even new pyramids.

The lidar system fires rapid laser pulses at surfaces and measures how long it takes that light to return to sophisticated measuring equipment. Doing that over and over again lets scientists create a topographical map of sorts. Months of computer modeling allowed the researchers to virtually strip away half a million acres of jungle that has grown over the ruins. What’s left is a surprisingly clear picture of how a 10th-century Maya would see the landscape.

Tags: lidar, spatial, remote sensing, geospatial, unit 1 GeoPrinciplesGuatemala, Middle America.

Source: www.washingtonpost.com

Burn Scars on California’s Wine Country

Devastating wildfires burned through California’s wine country in October 2017, taking several lives and leaving thousands of people homeless. On October 21, the Advanced Spaceborne Thermal Emission and Reflection Radiometer (ASTER) on the Terra satellite acquired this false-color image of the burn scars left by the Tubbs (upper left), Nuns (center), and Atlas (lower right) fires. Unburned vegetation appears red; burned vegetation appears brown. Buildings, roads, and other developed areas appear light gray and white.”


Tags: remote sensingdisasters, California, physical.

Source: earthobservatory.nasa.gov

The Edge of the Plates

“Tomales Bay lies about 50 kilometers (30 miles) northwest of San Francisco, along the edges of two tectonic plates that are grinding past each other. The boundary between them is the San Andreas Fault, the famous rift that partitions California for hundreds of miles. To the west of the Bay is the Pacific plate; to the east is the North American plate. The rock on the western shore of the Bay is granite, an igneous rock that formed underground when molten material slowly cooled over time. On the opposite shore, the land is a mix of several types of marine sedimentary rocks. In Assembling California, John McPhee calls that side “a boneyard of exotica,” a mixture of rock of ‘such widespread provenance that it is quite literally a collection from the entire Pacific basin, or even half of the surface of the planet.'”


Tags: geomorphologyremote sensing, tectonics, geology, Californiacoastal, physical.

Source: earthobservatory.nasa.gov

Lights of Human Activity Shine in NASA’s Image of Earth at Night

NASA scientists have just released the first new global map of Earth at night since 2012. This nighttime look at our home planet, dubbed the Black Marble, provides researchers with a unique perspective of human activities around the globe. By studying Earth at night, researchers can investigate how cities expand, monitor light intensity to estimate energy use and economic activity, and aid in disaster response.

Source: www.youtube.com

NASA scientists are releasing new global maps of Earth at night, providing the clearest yet composite view of the patterns of human settlement across our planet.  You can download the image at a good resolution (8 MB jpg) or at a great resolution (266 MB jpg) to explore at your leisure.  


Tags: mapping, perspective, images, geospatial.

Sprawling Shanghai

If you could go back in time to the 1980s, you would find a city that is drastically different than today’s Shanghai.

Source: earthobservatory.nasa.gov

This series of seven satellite images shows how quickly the economic development of China has impacted the urban sprawl of China’s biggest cities.  Pictures of the downtown area’s growth are impressive, but these aerial images show the full magnitude of the change. 


Tags: urbanremote sensing, megacities, China, urban ecology.

China installs weapons on contested South China Sea islands

New satellite imagery indicates that China has installed weapon systems on all seven artificial islands it has built in the contested waters of the South China Sea, a move that’s likely alarm the country’s neighbors.

UPDATE: After this news, the Pentagon says a Chinese warship has seized a US Navy underwater drone collecting unclassified data in international waters in the South China Sea.

Tags: borders, political, conflict, China, remote sensing, East Asia.

Source: www.cnn.com

Blog at WordPress.com.

Up ↑