Search

GEOGRAPHY EDUCATION

Supporting geography educators everywhere with current digital resources.

Tag

weather climate

Mapping the Wind

EarthNull

It is incredibly cold in New England right now.  How can maps help us to understand the weather patterns we are facing?  How is what we are facing in our community connected to global patterns?  Maps help us to contextualize information and understand processes.  So to investigate this our freezing wind conditions we will look at a series of online resources.

  1. Dynamic Wind Map of USA (Visualization).
  2. Interactive wind map (Ventusky).
  3. Interactive wind map (WindyTy).
  4. Digital Globe with Wind patterns (Null School)

GeoEd TAGS: physical,  weather and climate, mapping, visualization.

Ventusky – Wind, Rain and Temperature Maps

Animated wind, rain and temperature maps, detailed forecast for your place, data from the best weather forecast models such as GFS, ICON, GEM

Source: www.ventusky.com

With people on the East Coast concerned about the possible trajectories for Hurricane Florence, I think it is the right time to share these two interactive maps: Ventusky and Windy.  In the past, I also shared NullSchool’s  mesmerizing digital globe with wind data and many other options.  Collectively, these my three favorite online visualization of meteorological data.  Any other favorites?  To friends and family in the Carolinas, stay safe.   


Scoop.it Tags: physical, weather and climate, mapping, visualization.

WordPress TAGS: physical,  weather and climate, mapping, visualization.

Washington Journal Tim Frazier Discusses Hurricane Irma Disaster

https://www.c-span.org/assets/swf/CSPANPlayer.swf?pid=433726-4
//www.c-span.org/video/standalone/?433726-4

“Georgetown University’s Tim Frazier talks about the federal government’s management of disaster relief related to Hurricanes Irma and Harvey.”

Tim Frazier is not only a fantastic geographer with an expertise in disaster management, he was also my volleyball partner on the “Bad Latitudes” team at Penn State.  Good job Tim; great geographic insight and context to understand the response efforts.

Tags: disasters.

Disaster Mapping: Hurricane Irma, Mexico Earthquake and Bangladesh Floods

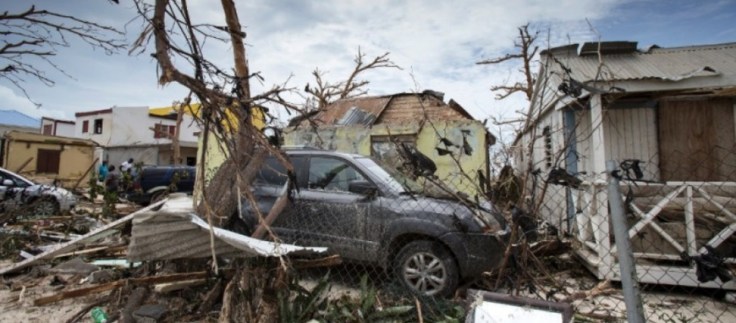
This week has seen disasters and destruction on an unprecedented scale, and the HOT Community has activated to respond. Hurricane Irma is the largest Hurricane ever recorded, and has torn death and destruction through the Caribbean. Destruction on some islands is estimated at 95%, affecting the lives of 1.2 million so far, and on track to cause severe destruction across the entire Florida State, where mass evacuation is currently underway. Barbuda’s prime minister, Gaston Browne, described the damage as absolutely heart-wrenching. ‘The island is literally under water and barely habitable,’ Browne said. ‘About 95% of properties are damaged, there is a serious threat of disease. Additionally, those already affected by Irma fear a second brutal battering by Hurricane Jose.'”

Source: www.hotosm.org

Want to see geographic knowledge and geospatial skills in action?  Crowd-sourced mapping is increasingly an important resource during an emergency.  Poorer places are often not as well mapped out by the commercial cartographic organizations and these are oftentimes the places that are most vulnerable to natural disasters.  Relief agencies depend on mapping platforms to handle the logistics of administering aid and assessing the extent of the damage and rely on these crowd-sourced data sets.  My students and I join OpenStreetMap (OSM) projects, especially when there is a major humanitarian need…it’s a great way to make service learning and geospatial technologies come together. The projects that are marked urgent by the Red Cross are all in Haiti right now.  Here are is a video playlist that explains the project and how you can help if you are new to OpenStreetMap (OSM).


Tags: disasters, mapping, edtechSTEM, weather and climate.

Human Settlement Predictive Model

“Simulating climate conditions over the last 125,000 years and predicting how those changes would have allowed humans to spread around the globe, this video models human migration patterns.” Read more: http://ow.ly/lWIp304qZEo

Source: www.youtube.com

The World Economic Forum noted that some spatial research that was originally published in Nature, shows how geneticists took DNA samples from people of different cultures in different parts of the world to track their dispersal throughout the globe.  The video uses climatic data, combined with the genetic data, to create a model showing how the human race spread across the globe over a 125,000 year period.


Tagsdiffusiondemographicsmappingmigration, populationhistorical, video, visualization.

Senegal’s Great Green Wall combats desertification

“A 7,000 km barrier is being built along the footsteps of the Sahara to stop the desert expanding. The Great Green Wall project started in 2007 in Senegal, along with 10 countries in Africa to combat the effects of climate change. Al Jazeera’s Nicolas Haque reports from Widou, deep in the Sahel.”

Source: www.youtube.com

The Great Green Wall initiative is composed of 11 countries that are cooperating together to combat the physical and human geographic characteristics that make the Sahel one of the more vulnerable ecosystems in the world.  This swath running through Africa is the transition zone where tropical Africa meets the Sahara.  The Sahel is susceptible to drought, overgrazing, land degradation and desertification.  These issues of resource management and land use transcend international borders so this “Green Wall” was created with the intent to protect the environment, landscapes and people of the Sahel from desert encroachment (the shorter, social media friendly version of this video is available here).


Tags: Africa, Senegal, development, environment, waterbiogeography, ecology, environment depend, physical, weather and climate, supranationalism, political ecology.

What are El Niño and La Niña?

“El Niño and La Niña are complex weather patterns resulting from variations in ocean temperatures in the Equatorial Pacific–officially known as the El Niño-Southern Oscillation (ENSO) cycle. These deviations from normal surface temperatures can have large-scale impacts not only on ocean processes, but also on global weather and climate.”

Source: oceanservice.noaa.gov

This short video from NOAA is an excellent summary that explains the ENSO cycle.  The video has a particular emphasis on how changing patterns in the Pacific Ocean currents can impact weather patterns in various regions of the United States.  


Tagsphysical, weather and climateregions, USA.

Climate Migrants

Climate change has already displaced tens of thousands of people. If it continues unabated, it could lead to one of the largest mass human migrations in history.

Source: storymaps.esri.com

This StoryMap shows some key regions where migrants are fleeing some of the negative impacts of climate change, a trend that appears very likely to increase in the future.  It is also an excellent example of the ESRI’s new Cascade template for creating a web app. 


Tags: physical, weather and climate, climate change, environment, resources, watercoastalmappingESRIStoryMap, visualization, environment depend, political ecology.

Australia flood: Uluru national park closed after huge rainfall

Record rainfall in central Australia leads to flash floods and the closure of Uluru national park.


Tags: Australia, environmentweather and climate, water.

Source: www.bbc.com

Create a free website or blog at WordPress.com.

Up ↑