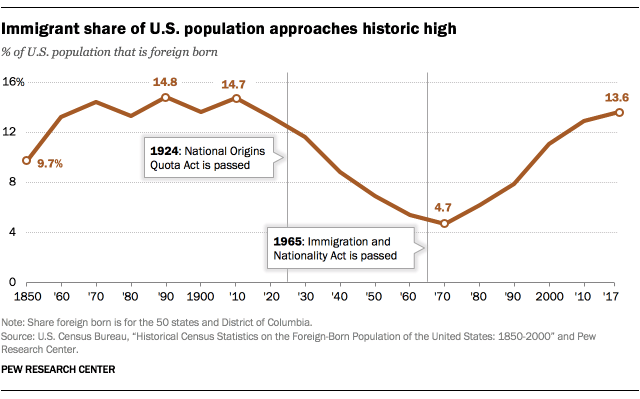
” Nearly 14% of the U.S. population was born in another country, numbering more than 44 million people in 2017, according to a Pew Research Center analysis of the U.S. Census Bureau’s American Community Survey. This was the highest share of foreign-born people in the United States since 1910, when immigrants accounted for 14.7% of the American population. The record share was 14.8% in 1890, when 9.2 million immigrants lived in the United States.” Source: Pew Research
The percentage of residents in the United States that are migrants (born in a country other than the United States) has been rising since the 1970. This is much higher than the global average of 3.4%, but not surprising given how economic pull factors are reshaping global demographic patterns. High-income countries attract more migrants; so the demographic impact on the global patterns of migrants is profound. High-income countries have 14.1% of their residents coming from other countries, where middle and low-income countries average between 1 and 2% for their percentage of migrants in their populations.
Questions to Ponder: What are some of the demographic, economic, cultural, and political impacts of these statistics? How might this impact certain regions?
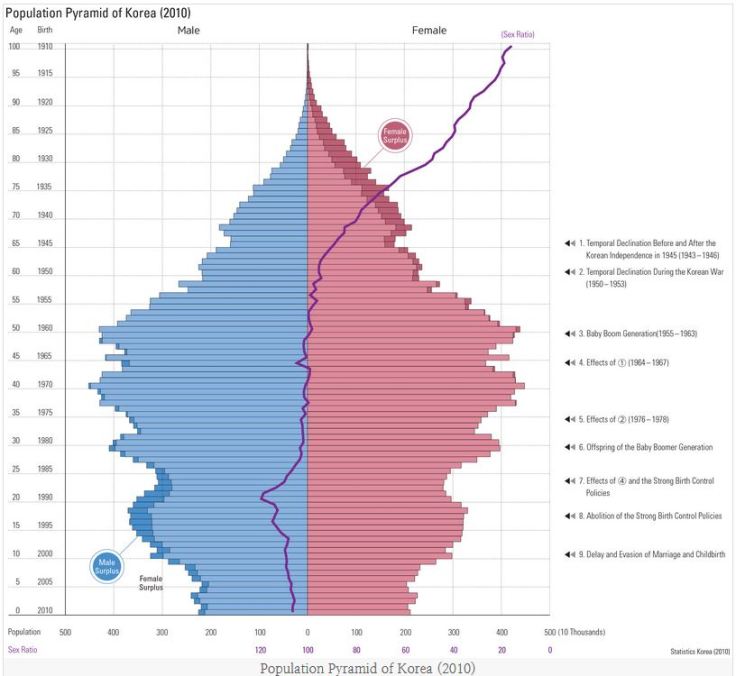
South Korea is the world’s first country to have a total fertility rate below 1 (in 2019, it dropped to 0.98). It may not be the largest population of the 86 declining populations (114 countries have TFRs above replacement level), but it makes for an incredibly important case-study to explore emerging demographic patterns because in the coming years, it probably won’t be the only country with a TFR below 1.
South Korean governments at multiple levels have implemented some pro-natalist policies (tax-benefits, cash incentives, maternity leave, paternity leave, etc.), and the TFR continues to drop. The economic reasons for this demographic decline make it a textbook example of a highly-developed economy where raising children is very expensive in a post-industrial, overwhelmingly urban context. However, I think more time should be spend investigating the cultural patterns that led more and more young adults to either postpone child-rearing or skip it all together. In South Korea, as in other countries, marriages are becoming more infrequent, but the social stigma associated with raising a child out of wedlock remains very strong (only 2% of births are to unwedded mothers). Many women returning to the workforce find that child-care options are limited they struggle to find the same wages that they had before they started a family. Even before without children though, women in South Korea are confronted with the highest gender wage gap among OECD countries. As reported in the WSJ, “South Korea has a strong economy, fast internet—and a big gender gap.” Korean work culture expects long hours, after hours social gatherings, and other practices that make it difficult to workers, but especially women, to find a manageable balance between having a career and a family. Many corporations are reluctant to hire/promote/mentor women that might conceivably conceive and leave the company.
Today, many Korean families see having no children as the only way to survive/improve their quality on life given the economic and cultural context within which they are operating. The government has been pouring millions of dollars to reverse this pattern but the fertility rate continues to drop. The video below gives an introduction to the issue.
This video provides a more in-depth look into the issue (turn on the closed captioning)
While many countries have anti-natalist policies (policies to discourage more births), other countries with declining populations have pro-natalist policies in an attempt to increase fertility rates. While not an exhaustive list, this list gives a few more examples that teachers can use to show how countries in stage 4 of the demographic transition are dealing with declining fertility rates.
The question “why do women live longer than men?” is both biological and cultural. This means that 1) gender as a cultural construct that influences behavior is a mitigating factor and 2) sex, as a biochemical issue, is a separate set of determining factors. Estrogen benefits women because it lowers “bad” cholesterol) and “good” cholesterol, but testosterone does the opposite. Women are more likely to have chronic diseases, but non-fatal chronic disease, but men are more prone to the more fatal chronic illnesses. For the cultural reasons, men are less likely to seek treatment, adhere to the prescribed treatment, commit suicide, and engage in more risky behavior. While these may read like a list of gendered stereotypes that don’t apply to all, when looking at the global data sets, these trends hold and are more likely to be true. How masculinity and femininity is constructed certainly shapes many of these factors and deserves some discussion.
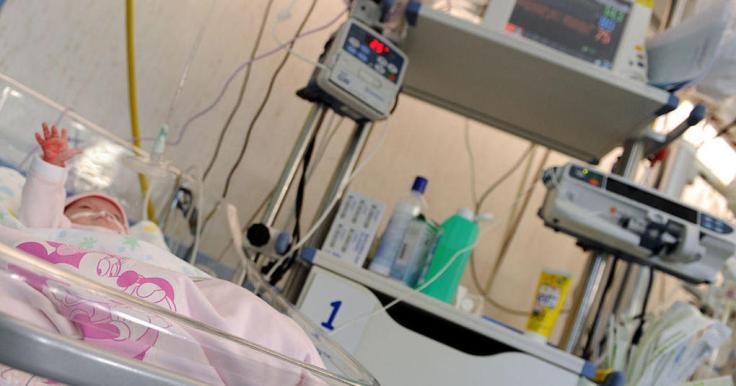
“All newborn children in Scotland will receive the boxes by the summer following a three-month pilot. The boxes include clothing, bedding and toys and are based on a project that has been running in Finland since 1938 to give all children an equal start.”
Just before World War II, the Finnish government provided boxes filled with material goods to expectant mothers with the hopes of improving infant mortality rates, pre-natal care, and promoting good parenting. The baby box was born and not surprisingly, Finland has the best infant mortality rates in the world. Now Scotland is implementing a similar program as this idea is has diffusing around the world.
“Facing a low fertility rate (1.4), Italy is holding its first ‘Fertility Day‘ on Sept. 22, which will emphasize ‘the beauty of motherhood and fatherhood’ and host roundtable discussions on fertility and reproductive health. That may seem inoffensive, but the country’s health department is trying to raise awareness with an ad campaign that’s striking many as misguided and, worse, sexist and alarmist.”
This pro-natalist campaign designed by the health ministry has received near universal criticism (in an attempt to see other perspectives, I searched for a more positive or even neutral article on the topic and came up empty-handed). Italy’s Prime Minister openly scoffed at the premise of the campaign, and many pundits argue that it shames and pressures women into thinking about personal choices of childbearing as if they were communal responsibilities. Unlike the infamous ‘Do it For Denmark‘ advertisements that were filled with playful innuendos, or Singapore’s ‘Maybe Baby‘ which highlights the joys of parenthood, this one has more overtones of duty and plays on fear more than those other pro-natalist campaigns.
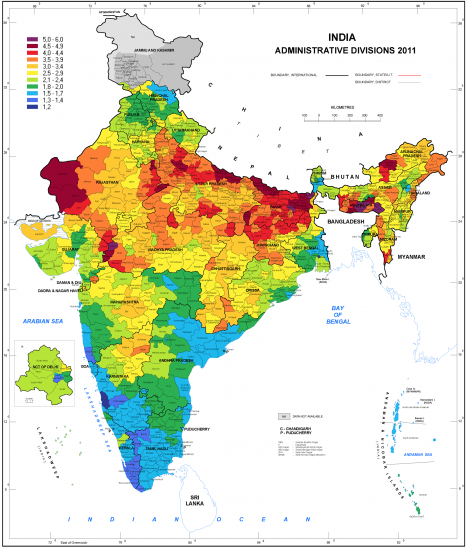
“An important aspect about country level data of fertility to keep in mind is that there can be considerable heterogeneity within countries, which are hidden in the mean fertility which were discussed in this entry. The mean Total Fertility Rate for India in 2010 was 2.8 (UN Data): But this average hides the fact that the fertility in many Southern Indian regions was below 1.5 (which is similar to the mean fertility in many European countries), while the fertility in Northern India was still higher than 5 children per woman (which is as high as the mean of the African countries with the highest fertility).”
This is a stunning example of uneven development and regional differences within countries. Too often we discuss countries as if the situation inside the borders of one country is the same throughout it, even if the geographic contexts can be wildly different.
Questions to Ponder: Why are the fertility rates in so different in northern and southern India? How does this regional imbalance impact the country? What are other examples of major differences within a country?
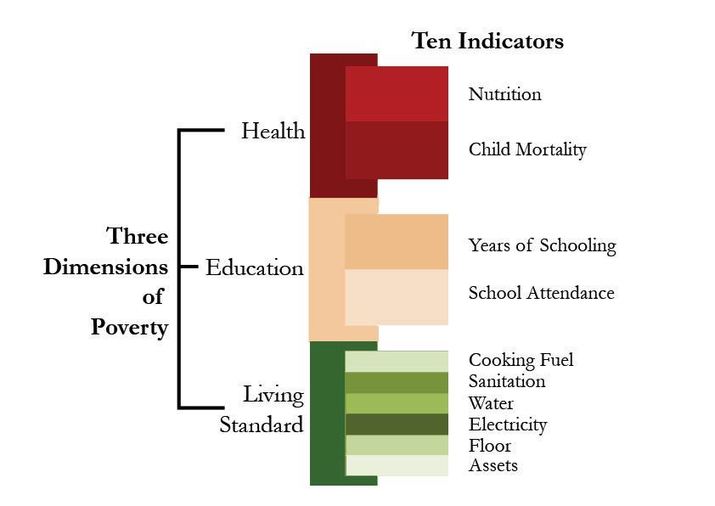
“The global Multidimensional Poverty Index (MPI) is an international measure of acute poverty covering over 100 developing countries. It complements traditional income-based poverty measures by capturing the severe deprivations that each person faces at the same time with respect to education, health and living standards.”
The MPI was developed out of a desire to fill some of the gaps in the HDI’s applicability and utility. Allow me to quote the editor of one the NCGE’s journals, the Geography Teacher, on the usefulness of the MPI website for classroom use: “With the infographics, maps, graphs, country briefings, and case studies, you have a ready-made lesson activities to demonstrate patterns of fertility, mortality, and health for a population unit, and access to health care, education, utilities, and sanitation for an Industrialization and Economic Development Unit. Connections can also be made to malnutrition and water, as well as to key concepts such as pattern and scale, to key geographical skills such as how to use and think about maps and geospatial data, and to the use of online maps and online data.” Also, this article from the World Bank also give a run-down on the key findings of the MPI in 2014.