“The wonders of modern medicine and nutrition make it easy to believe we enjoy longer lives than at any time in human history, but we may not be that special after all.” SOURCE: BBC
This BBC article explores many of our assumptions about demographic issues before statistics were recorded. This article especially looks at the notion that our life span has been increasing throughout history. This would be a good article to get some background information about stage 1 of the demographic transition. In a nutshell, the article’s premise is that just because life expectancy is increasing, it does not mean that our lifespan is the main reason. The main reason life expectancy has improved is that more children are surviving their early years not because we have extended the lifespan of elderly so much.
There are far too many geographic issues that stem out of the Coronavirus pandemic to create anything close to comprehensive, but I wanted to share some of the articles that caught my eye recently because they touch on particularly geographic themes. So, this will not give a global overview, predictions, or breaking news, but some of the underlying issues and questions that we are now grappling with as so many are now in some form of self-isolation.
MAPPING: The best, introductory-level walk-through of how to map the Coronavirus uses ArcGIS online, and has interactive layers that are updated daily, so you don’t have to recreate the wheel for every time new data gets released. If students are familiar with ArcGIS and already have an account, this is worth having them explore it to learn cartographic techniques.
ENVIRONMENT: There are a host of unintended consequences in natural systems, and when one part of the system, gets altered, there are some down-stream impacts. This article in the Atlantic discusses some of the environmental impacts of the mass shutdown of normal human activities (1-less pollution, 2-less seismic activity, 3-quiter urban environments).
DEVELOPMENT: The impacts of COVID-19 are clearly uneven; countries and cities that are the most globally connected might benefit usually economically from these connections, but are facing one of the times that this connectivity is a threat to the community. India, by and large through March 2020, managed to avoid making global headlines, but as the world’s second largest population with some incredibly dense megacities, many are asking how the Coronavirus will impact India in the coming weeks.
URBANIZATION: In the United States, the densest counties have been the most impacted by COVID-19 while rural areas have need been as heavily impacted (by and large—rural counties with ski resorts are one prominent exception to this generalization). Some are discussing urban density in the time of a pandemic, and there are calls to rethink densely populated cities. This article from CityLab also discusses the density as a key issue in the transmission of disease, but it is quick to point out other factors that lead some hyper-dense cities to effectively control the spread as well.
CULTURE: To wear a mask, or to not wear a mask? Why is this a question that seems so controversial? As more time goes by, we see that wearing a mask to prevent the spread of a disease is not just a medical issue, but also a cultural issue. Some cultures are uncomfortable with the idea of covering part of face in public and some react against the concept because of the cultural connotations that go along with mask-wearing. Other societies see if as a prudent way to do your civic duty. Many are reconsidering their cultural norms that they associate with masks as COVID-19 continues to expand into more communities.
DIFFUSION: This video centers on the beginnings of the spread of the Coronavirus and the origins in Wuhan. I’m very sensitive to the fact that many discussions about its origin in China can quickly go down some racist paths. This Vox video explains the wet markets of China as a likely source of infectious disease without veering into racist assumptions. This interactive from the NY Times explains how the disease spread beyond China.
Stay healthy, stay safe. I miss other humans, and being social. I think everyone wishes things were different, but geography and spatial analysis is one of the key lenses that we need to come out on the other end of this. I hope that we can come out of this more united as members of the human race with a greater resolve to work together to solve global issues.
In many geography classes, teachers will assign students a country to help them gain some depth about one particular country as a way to explore economic, demographic, cultural, political, and environmental issues. These are some data visualization tools that deals with big data; the listed tools are some of my favorite in part because they can easily to incorporated to an ArcGIS StoryMap (especially in the Map Journal template).
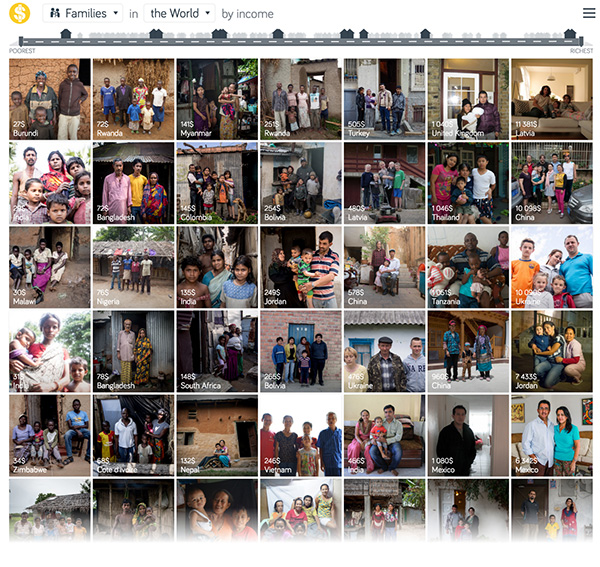
Economic (introductory data):Dollar Street from Gapminder
The best comparison and the most relatable thing for students to see in other countries is real people, leading regular lives. Dollar Street brings the economic realities of other places without some of the of the negative stereotypes or romanticizing far-away places.
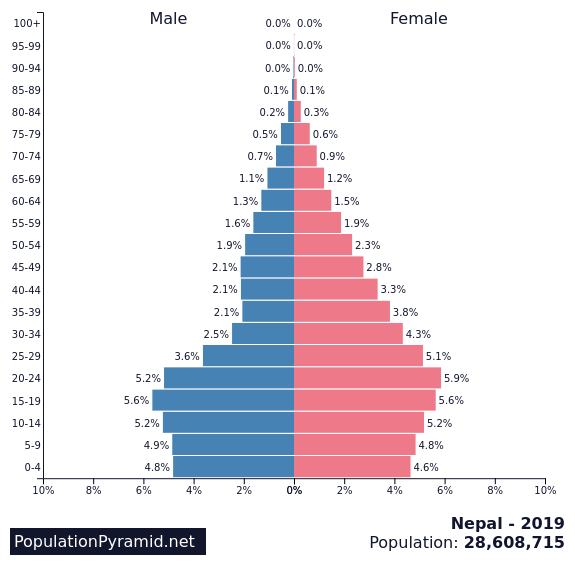
Populationpyramid.net creates interactive, population pyramids that can be downloaded as image with the raw data also available for download. Simple, powerful, easy.
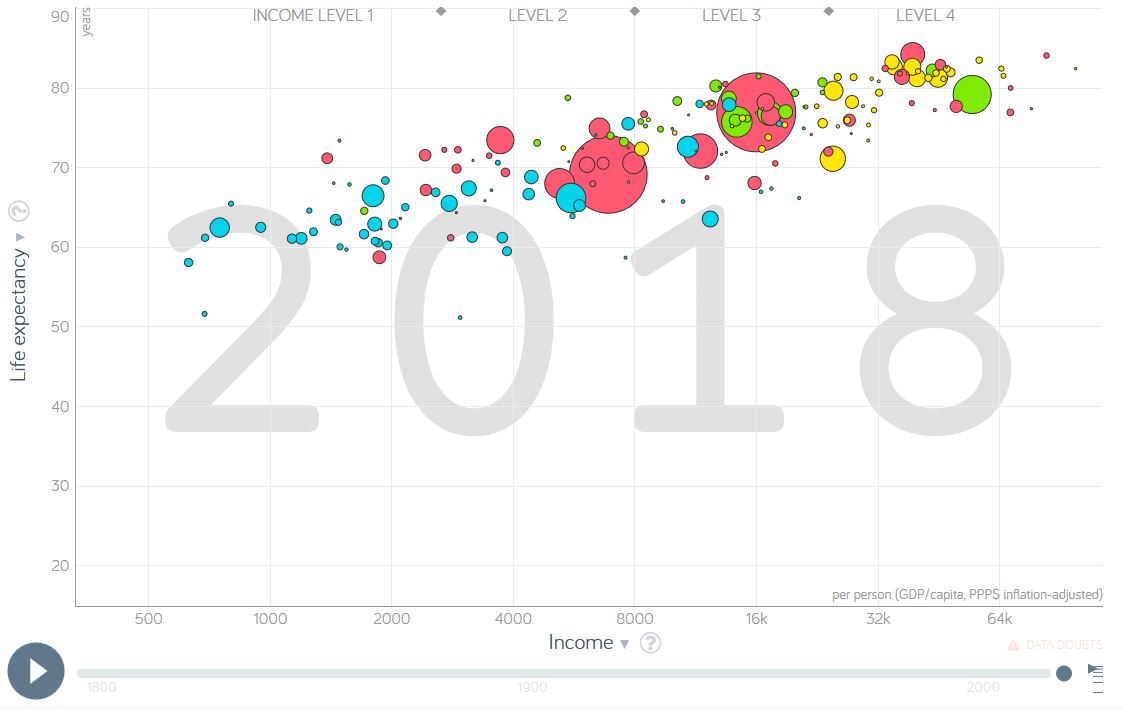
Gapminder is a tremendous resource that I’ve shared in the past and total fertility rates is an ideal metric to see in this data visualization tool. This is one of the best ways to visualize global statistics. The world is changing–see how.
5. Our World in Data
Like Gapminder, Our World in Data is a fantastic source of global data, maps, and charts on an incredibly wide range on topics. Type any country name in the search bar, and you’ll find a wide range of metrics.
6. ArcGIS StoryMaps
This is my principle cartographic tool that I use in GEOG 201 (Mapping our Changing World). Classic Story Maps is the feature that ArcGIS has to make user-friendly platform to share maps along with a rich, multimedia environment with a variety of pre-made templates. The video below is and introduction to the newer Story Builder which combines a variety of the elements of the templates into one that is more optimized for mobile devices.
7. Google Earth (now completely online)
Google Tours used to be a way to present a series of places on a map, with text, pictures, and videos, but that has been de-commissioned and the online version of Google Earth is now the best alternative. Yes, it works best in Google Chrome, and you’ll need a Google account to save it to your Google Drive. The video below is a brief introduction to the tools that are available to you:
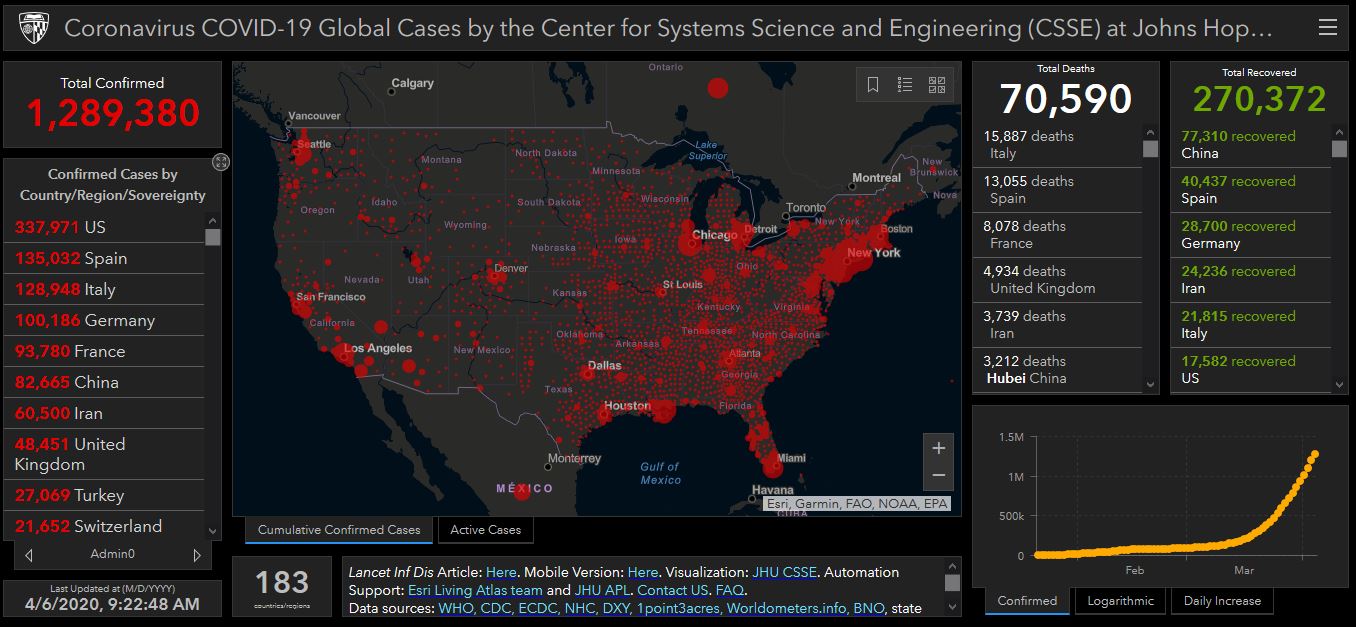
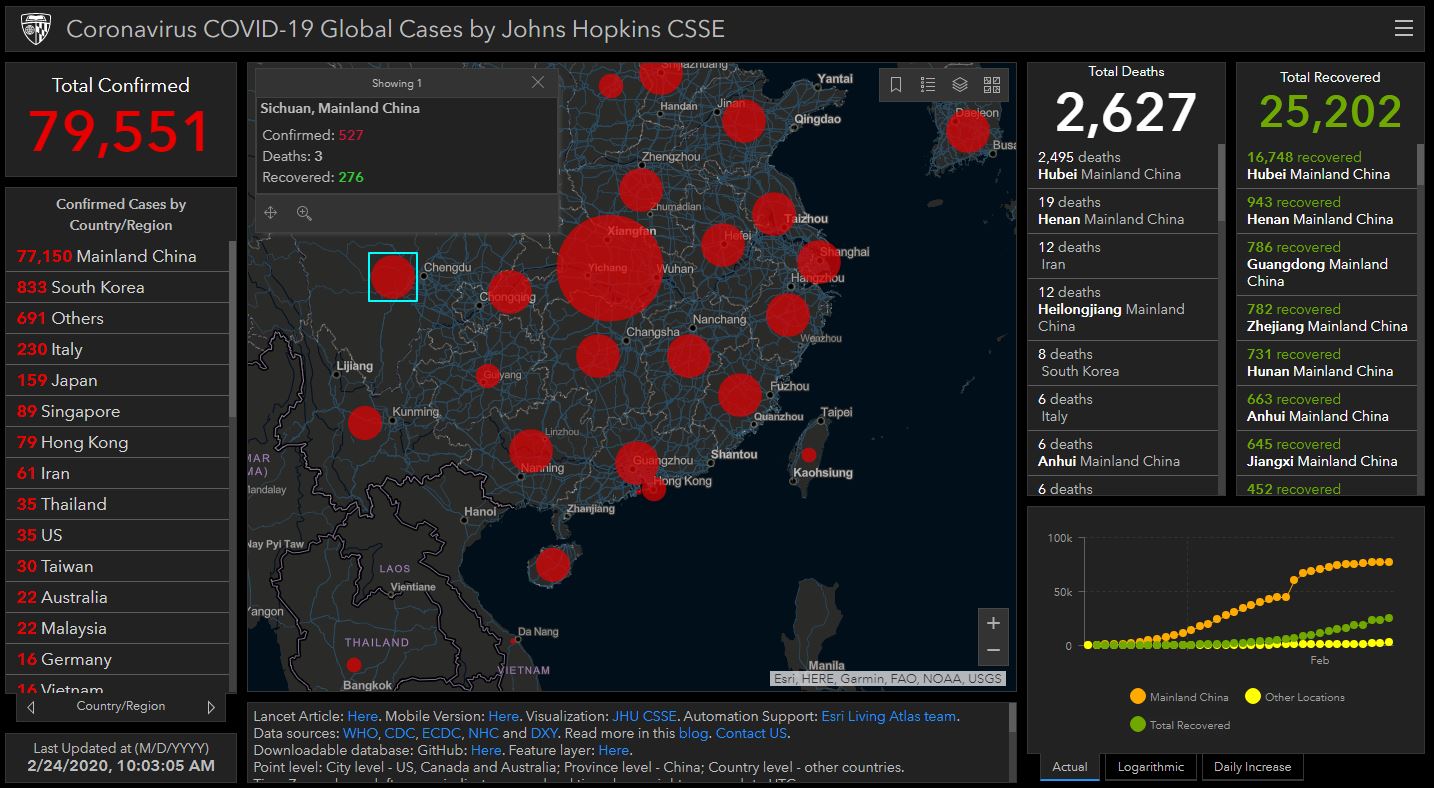
“We are tracking the COVID-19 spread in real-time on our interactive dashboard with data available for download. We are also modeling the spread of the virus.” SOURCE: GIS and DATA at Johns Hopkins University
The video below covers 3 major economic impacts that the virus will have on the global economy. In short, 1-Tourism and Travel, 2-Supply Chains, and 3-Flight to Quality Goods.
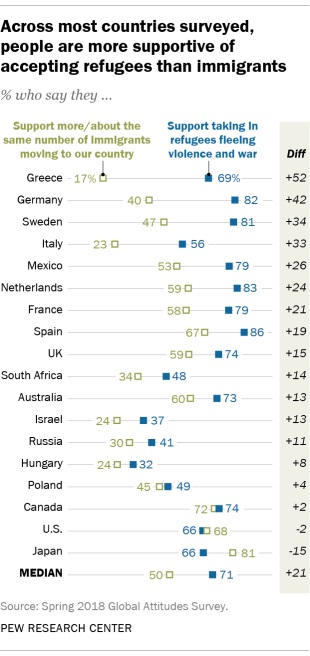
“On balance, people around the world are more accepting of refugees fleeing violence and war than they are of immigrants moving to their country, according to a new analysis of public opinion data from 18 nations surveyed by Pew Research Center in spring 2018.” SOURCE: Pew Research Center
We know that there are diverse perspectives on migration in our own country, but it is important to remember that our country’s conversation is also a part of a global conversation. As many developed countries are trying to limit some of the permeability of their borders, and as economic migrants seek to improve their economic opportunities, the immigration debates become more central to Since there has been As the Pew Research data shows, in North America, the immigration discussion and the refugee discussion have converged, where in countries such as Greece they are very much different conversations.
Questions to Ponder:
Why might the immigration and refugee assistance questions elicit a greater distinction in European countries (such as Germany, Italy, and Greece) then it did in North American countries (such as the U.S. and Canada)?
What are some impacts of the convergence of the political conversations surrounding immigration and refugee assistance for the United States and its policies?
% who support taking in refugees:
🇪🇸 ESP 86%
🇳🇱 NED 83
🇩🇪 GER 82
🇸🇪 SWE 81
🇫🇷 FRA 79
🇲🇽 MEX 79
🇨🇦 CAN 74
🇬🇧 UK 74
🇦🇺 AUS 73
🇬🇷 GRE 69
🇯🇵 JAP 66
🇺🇸 US 66
🇮🇹 ITA 56
🇵🇱 POL 49
🇿🇦 SA 48
🇷🇺 RUS 41
🇮🇱 ISR 37
🇭🇺 HUN 32https://t.co/8yTIWXgRRi
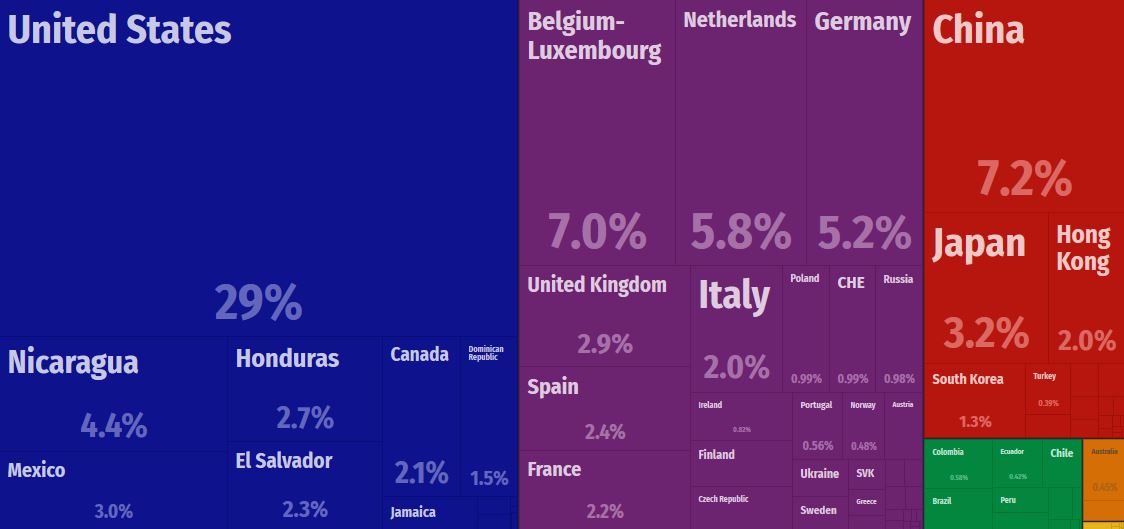
“We offer a variety of resources on U.S. Export/Import Trade with the World with millions of free datasets.” Source: U.S. Trade Numbers
This data visualization tool is very reminiscent of the Atlas of Economic Complexity. While the Atlas of Economic Complexity is better for exploring global trade patterns, this site adds a local impact to the global economy. Users can explore the major port of entries and see what goods are entering or leaving the United States from particular cities as nodes in global transportation networks. The permeability of borders are an economic necessity to take advantage of the economies of scale.
I know that YOU know that China ended the One-Child Policy, but many incoming college freshman have a world view about population that is a generation behind on many of the current population trends. This video discusses most of the APHG population topics using China as the world’s most important population case study–that makes this video excellent to show in a regional or human geography course.
"Don’t listen to the gloom-sayers. The world has improved by every measure of human flourishing over the past two centuries, and the progress continues, writes Steven Pinker."
I just finished Hans Rosling’s book, Factfulness. It was an absolutely delightful read (who wouldn’t want to imagine hearing Hans Rosling’s voice while relaxing on the beach?). So much of the populace have outdated paradigms about the world and too many have an overly pessimistic worldview that everything is getting worse. This is why FACTFULNESS is so needed day. This term is used to describe a fact-based, data-driven worldview that is not overly dramatic, or fear-based. In so many ways, the world has been consistently getting quantifiable better; this derived from an optimistic perspective, but a factful understanding of the world today. This book is his clarion call to understand the world as it actually is and is the culmination of his professional achievements. Now that he has passed away, it feels like a major part of his lasting legacy. If you’ve ever used his TED talks, Gapminder, the Ignorance Project, or Dollar Street resources, this is a must read.