Search

GEOGRAPHY EDUCATION

Supporting geography educators everywhere with current digital resources.

Author

sethdixon

I am a geography professor at Rhode Island College.

Why everyone should be able to read a map

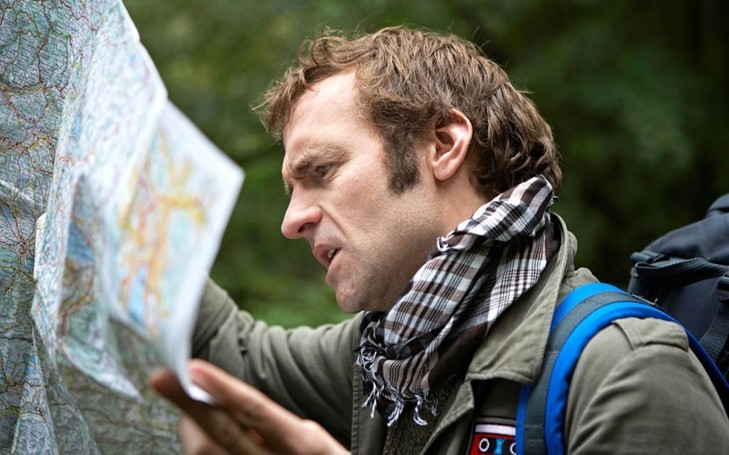
New research suggests that map reading is a dying skill in the age of the smartphone. Perish the thought, says Rob Cowen

Source: www.telegraph.co.uk

Despite the gendered overtones of the article (that it’s important for men to learn to read a map), this is some good advice, regardless of gender.  The vocabulary and concepts of maps can strengthen spatial cognition and geography awareness.  While GPS technology can help us in a pinch, relying primarily on a system that does not engage our navigation skills will weaken our ability to perform these functions.  While it intuitively makes sense, that the ‘mental muscles’ would atrophy when not used, it is a reminder that an overuse of geospatial technologies can be intellectually counterproductive.  So break out a trusty ol’ map, but more importantly, be a part of the spatial decision-making process. 


Tagsmappingspatial, technology, education.

This Fall, Minorities Will Outnumber White Students in U.S. Schools

“While 62 percent of the total U.S. population was classified as non-Hispanic white in 2013, when public schools start this fall their racial landscape will reflect a different America.”

Source: www.theatlantic.com

A new report new shows the changing demographics in American education and how it differs from that of the general population.  The demographic shifts in the United States are transforming the cultural fabric of the country and this interactive feature from the Pew Research Center explores some of these changes.  What are some of the reasons and what are some of the impacts?

Tag: declining populations, population, demographic transition model, USA.

Mystery of Death Valley’s ‘Sailing’ Stones Solved

There’s a place in Death Valley National Park where a mystery that has puzzled scientists and park visitors for decades finally has been solved.

Source: www.weather.com

The video in this article (weather.com) nicely explains how the non-aerodynamic rocks of Death Valley’s Racetrack Playa move, leaving behind their trail in the hot desert.  Numerous attempts using GPS receivers (NatGeo.com) and good ol’ fashioned observations have been made, but observing ice in Death Valley is so rare that no one had ever seen it until now (phys.org).  On very rare occasions, when it rains in the region, water will accumulate in the playa (discovermagazine.com).  If the wind is powerful and consistent enough, the wind will push the panels of ice against these rocks and over time, the ice floes will push these rocks, leaving behind distinctive trails (latimes.com). This perfect combination of water, wind, ice and heat creates a remarkable signature on the landscape (livescience.com).

Tags: physical, geomorphology, landforms, deserterosion, weather and climate, landscape.

The First Day of School Around the World

Take a look at the first day of school celebrations around the world!

Source: kidworldcitizen.org

Access to education is one of the great indicators of development and political stability–educators wish nothing but the best education possible for the next generation, but the experience is quite variable across the globe.  As many places have recently started school again, this article is a reminder that this practice is experienced differently around the world. 

TagseducationK12, developmentperspective, worldwide.

Local Shifts in Labor Demand

“Daily oil production in the Bakken is approaching one million barrels per day, placing it in an elite group of only ten super-giant oil fields in the world that have ever produced that much oil at peak production. In total, nearly one billion barrels of oil have now been produced in the Bakken oil fields, and all of that oil production and related activities have brought the unemployment rate in the Williston area down to below 1% in most months over the last three years. For the most recent month – April – the jobless rate here was 0.9%.”

Source: www.aei-ideas.org

As an oil boom has transformed North Dakota, the influx of oil workers has changed all the sectors of the local economy.  Agriculture has historically been the #1 economic contributor in the region, but huge piles of grain aren’t be shipped to the market, as oil by rail is much more profitable.   

Questions to Ponder: Why is WalMart offering such high wages in North Dakota?  What local factors impact the prevailing wage rate?  What does this tell us about places with low wages?  How does the oil industry impact all the others in the region?     

Tags: manufacturing, economic, North America, labor, USA.

Fragile States Index

“Weak and failing states pose a challenge to the international community. In today’s world, with its highly globalized economy, information systems and interlaced security, pressures on one fragile state can have serious repercussions not only for that state and its people, but also for its neighbors and other states halfway across the globe.  The Fragile States Index (FSI), produced by The Fund for Peace, is a critical tool in highlighting not only the normal pressures that all states experience, but also in identifying when those pressures are pushing a state towards the brink of failure.”

Source: http://fundforpeace.org/fsi/analytics/fsi-heat-map/

How can political stability and security be measured?  What constitutes effective governance?  The Fragile States Index (formerly known as the Failed States Index) is a statistical ranking designed to measure the effective political institutions across the globe.  There are  12 social, economic, and political/military categories that are a part of the overall rankings and various indicators are parts of the metrics that are a part of this index are:

SOCIAL

•Demographic Pressures

•Refugees/IDPs

•Group Grievance

•Human Flight and Brain Drain

ECONOMIC

•Uneven Economic Development

•Poverty and Economic Decline

POLITICAL/MILITARY

•State Legitimacy

•Human Rights and Rule of Law

•Public Services

•Security Apparatus

•Factionalized Elites

•External Intervention


Tags: political, statisticsdevelopment, territoriality, sovereignty, conflict, political, devolution, war.

The 9 biggest myths about ISIS

If you want to understand the Islamic State, better known as ISIS, the first thing you have to know about them is that they are not crazy. Murderous adherents to a violent medieval ideology, sure. But not insane.

Source: www.vox.com

This interactive is a series of related articles, each designed to tackle popular narratives that have been constructed to explain ISIS; there are bits of truths in these myths, but they fail to fully contextualize the reality on the ground.  These nine myths are:

  1. ISIS is crazy and irrational
  2. People support ISIS because they like its radical form of Islam
  3. ISIS is part of al-Qaeda
  4. ISIS is a Syrian rebel group
  5. ISIS is only strong because of Iraqi Prime Minister Maliki
  6. ISIS is afraid of female soldiers
  7. The US can destroy ISIS
  8. ISIS will self-destruct on its own
  9. ISIS is invincible


Tags: SyriaIraq, MiddleEast, conflict, political, geopolitics.

What Does Earth Look Like?

Source: www.youtube.com

This video covers various topics important to mapping and satellite imagery (and a lesson from an APHG teacher on how to use this video with other resources).  There is so much more to the world and space than what we can see see.  Chromoscope, referenced in the video, simulates other forms of energy on the electromagnetic spectrum besides just visible light.  This type of information is at the core of the science behind all of our satellite imagery.  This video also covers many map projection issues and highlights online resources to understand map distortion including:


Tags: mapping, perspective, images, remote sensing, geospatial, unit 1 Geoprinciples.

Animated GIFs of Earth Over Time

“It took the folks at Google to upgrade these choppy visual sequences from crude flip-book quality to true video footage. With the help of massive amounts of computer muscle, they have scrubbed away cloud cover, filled in missing pixels, digitally stitched puzzle-piece pictures together, until the growing, thriving, sometimes dying planet is revealed in all its dynamic churn. The images are striking not just because of their vast sweep of geography and time but also because of their staggering detail.”

Source: plus.google.com

This interactive feature shows time lapse satellite imagery of some selected locations that have experienced rapid environmental change in the last few decades (or you can simply watch the animated GIFs).  These images are a way to show the power of remotely sensed data as well as massive environmental impact of rapid urbanization and globalization and the feature allows students to explore these places on their own.   

Tags: remote sensing, time lapse, land use, environment, geospatial, environment modifyurban ecology.

Create a free website or blog at WordPress.com.

Up ↑