
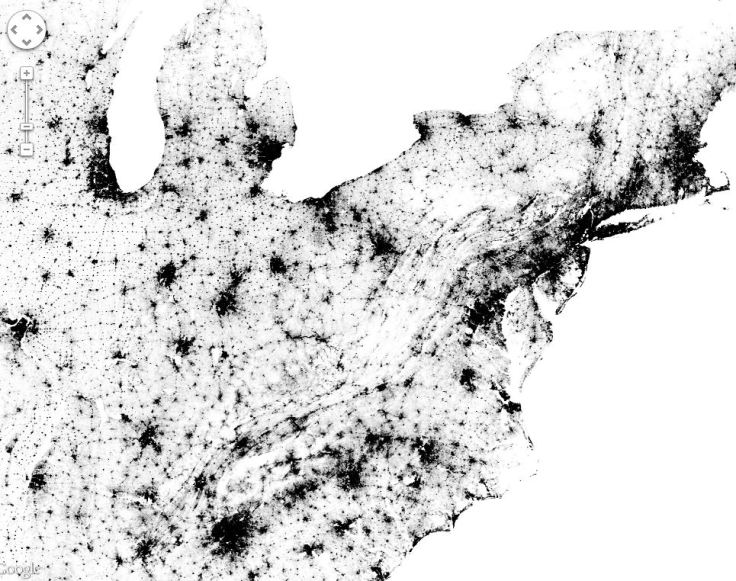
This interactive dot distribution map of the United States 2010 census data has many great applications. The conversation can focus on the symbology of the map (for example, this could lead to a discussion of the advantages and disadvantages of a dot distribution maps) or notice how the certain physical landforms are visible for either their high or low population density. One of the advantages of this map is that it uses census data at the block level. This means that the user can visualize distinct scale-dependent patterns. Sharp divisions (e.g.-urban vs. rural) might have less of a distinct edge as you zoom in.
UPDATE: This map now includes Canadian census data as well as the United States.
Tags: cartography, technology, mapping, visualization, population, density.
See on bmander.com


 “Forget politics. Muslim countries are poised to experience a new wave of change — but this time it’s all about demographics.”
  Who wants to practice medicine in a country where they use power tools in surgery? The dilemma of doctors in the developing world.


