Search

GEOGRAPHY EDUCATION

Supporting geography educators everywhere with current digital resources.

Category

Uncategorized

Proportion of Catholics in Latin America has dropped 25% since 1970

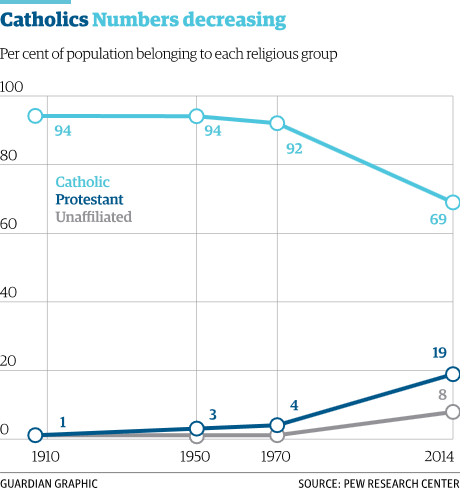
“A new report released by the Pew Research Centre has found that the proportion of Catholics in Latin America has dropped 25% since 1970. One of the primary drivers for the rise in the numbers leaving the Catholic Church? Conversion to Protestantism.”

Source: www.theguardian.com

This is an important cultural and demographic shift that is redefining how we think about Latin America.  It also represents a major shift in the geography of the Catholic Church.   

Tags: culturereligion, Christianity.

How the Global Population Boom Really Began

The Industrial Revolution gets credit for kicking off the world’s human population explosion, but new research suggests we should look further back.

“If you dig further in the past,” Stutz told Emory University, “the data suggest that a critical threshold of political and economic organization set the stage around the start of the Common Era. The resulting political-economic balance was the tipping point for economies of scale: It created a range of opportunities enabling more people to get resources, form successful families, and generate enough capital to transfer to the next generation.”


Tag: population.

Source: www.citylab.com

The economic threat to cities isn’t gentrification; it’s the opposite

Many urban neighborhoods are places of concentrated poverty, and it’s killing opportunity in the US.

American cities are growing, and as they grow, they’re adding lots of high-poverty neighborhoods. Nearly three times as many “high-poverty” census tracts existed in 2010 as in 1970.  That’s unsettling on its face but even more so when you see the havoc a poor neighborhood can wreak on a resident’s chances at a good life. Forget gentrification — this is a bigger problem. 

The chart above tallies up the people living in these neighborhoods in 1970 and 2010. What it shows is that the number of people living in high-poverty neighborhoods — those with poverty rates of 30 percent or more — has roughly doubled since 1970. That’s because these neighborhoods of concentrated poverty have a tendency to stay that way, even while new ones sprout up.

Tags: urban, unit 7 cities, housing, economic, povertyplace, socioeconomic, neighborhood.

Source: www.vox.com

Town Slowly deformed by Plate Tectonics

“The signs that something’s wrong are not immediately obvious, but, once you see them, it’s hard to tune them out. Curbs at nearly the exact same spot on opposite sides of the street are popped out of alignment. Houses too young to show this kind of wear stand oddly warped, torqued out of sync with their own foundations, their once-strong frames off-kilter. This is Hollister, California, a town being broken in two slowly, relentlessly, and in real time by an effect known as ‘fault creep.’ A slow, surreal tide of deformation has appeared throughout the city.”

Tags: disasters, geomorphologyCalifornia, physical.

Source: www.thedailybeast.com

NatGeo Maps on Google

The National Geographic Society has been inspiring people to care about the planet since 1888. National Geographic Maps publishes more than 100 new print maps annually and is a leading developer of digital map content found in websites and award-winning mobile apps. All proceeds from the sale and licensing of National Geographic maps go to support the Society’s vital exploration, conservation, research and education programs. www.natgeomaps.com

Source: maps.google.com

Have you ever wanted an archive of all the fabulous maps produced by National Geographic?  And what if you could preview a digital version of all of these NatGeo maps seamlessly on Google Maps?  That is exactly what this gallery delivers.   

Probability of a White Christmas

See which places have the best chance of being a winter wonderland on Christmas Day according to weather history.

Source: www.ncdc.noaa.gov

This is not a weather report; we are still too far out to start predicting that with any accuracy.  What this map does show is the statistical probabilities of snow cover throughout the United States for December 25th based on past climatological data.   

Cultural and Historical Geography of Santa Claus

A look into Smithsonian’s vast archives reveals that Father Christmas tends to get a makeover with every generation that embraces him

Source: www.smithsonianmag.com

The picture archives show the historical evolution behind the cultural representations of Santa Claus.  Additionally this ESRI story map shows some of the regional differences in Santa Claus, showing how the cultural diffusion of this icon of a Christian holiday takes on real local attributes.  I also enjoyed these pictures from the BBC of Christmas around the world.  Merry Christmas to those that celebrate it and a Happy New Year to all.

Women & Agriculture

“In this Feed the Future video, narrator Matt Damon discusses the importance of increasing food production around the world and notes the importance of equipping women with the right tools, training, and  technology to see as much as a 30 percent increase in food production. To feed our growing population we need to increase food production by 70 percent before 2050. Women make up the majority of the agricultural workforce in many areas of the world.”

Source: www.youtube.com

A colleague mine thought that the ideas in this video were so obvious and non-controversial, he said, “Why does this even need to be stated? Why would we exclude women from agriculture?”  The simple answer is that it wouldn’t need to be stated if women around the world did have equal access to resources.  For many of the world’s poor, this is where the rubber meets the road. 

Tags: developmentgender, agriculture, food production, labor.

Gravitational Pull

“Revolution and rotation are the terms we use to describe the motions of the earth and moon. Revolution is the movement of the earth in an orbit around the sun.  The Earth completes one revolution around the sun every 365 days. The moon revolves around the Earth about once every month.” 

Source: www.nowykurier.com

Understanding the relationships between the Sun, Earth and moon are critical for for understanding the seasons, climate and other geographic factors.  This interactive simulates gravity unlike anything I’ve every seen on a computer screen. 

To exploring Earth-Sun interactions, playing around with the University of Nebraska-Lincoln’s Sun Simulator is a fun way to make a little more sense of the various factors that control how the Sun appears in the sky.

Blog at WordPress.com.

Up ↑