Search

GEOGRAPHY EDUCATION

Supporting geography educators everywhere with current digital resources.

Category

Uncategorized

The long and ugly tradition of treating Africa as a dirty, diseased place

How alarmist, racist coverage of Ebola makes things worse. A dressing down of the latest #NewsweekFail.

Source: www.washingtonpost.com

The recent Newsweek Cover showing a Chimpanzee for the article, Smuggled Bushmeat Is Ebola’s Back Door to America, has received a lot of criticism for being factually inaccurate, but also for it’s portrayal of Africa that taps into deep-rooted cultural anxieties about Africa in United States.  Western writers have use many cultural conventions to talk about “the Dark Continent” stemming from a long colonial tradition.  Africa had been developing rapidly in the last decade and how Ebola fares seems to be a referendum on the continent for many cultural commentators.  This great Washington Post article is less about Ebola, but uses the outbreak to analyze how we think about Africa, and sometimes it isn’t a pretty reflection.  The Ebola outbreak is teaching us how we perceive Africa as much as it is about Africa itself.


Tags: Ebola, Africa, colonialism, regions, perspective.
Map Fight

Source: mapfight.appspot.com

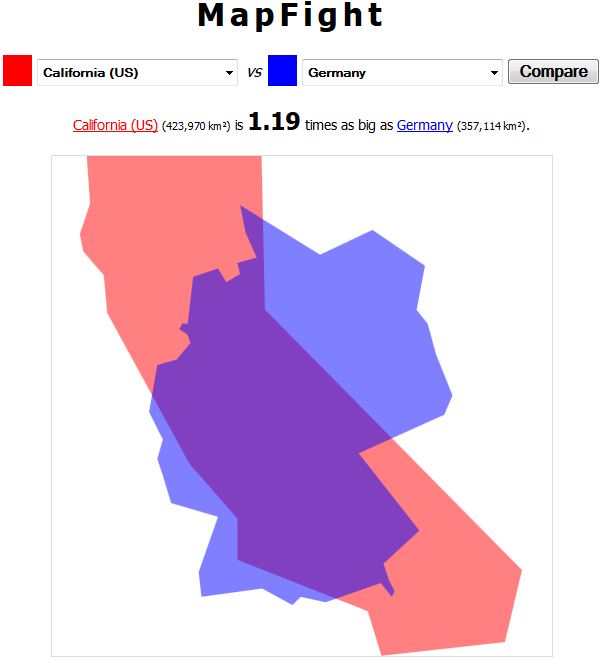
This simple WebApp allows the user to compare areas that are hard to compare on a map or globe because of distance or the map projection.  Competitive students love to hypothesize and then verify.  This helps strengthen student’s mental maps and their ability to make regional comparisons. 

Tags: mapping,  K12, perspective, scale.

What would happen if humans became extinct?

Source: www.youtube.com

What would Earth be like if all humans suddenly disappeared? This question posed on the YouTube series Earth Unplugged, has many intriguing ecological and biogeographic ramifications that are worth considering to explore how systems are interconnected. 

Tags: biogeography, environment, ecology, video.

Troubles on Russia’s Lake Baikal

“Workers at an ailing paper mill in Siberia are clinging to their jobs in the face of financial pressure and criticism from environmentalists.
Related Article: http://nyti.ms/gSvOkM“

Source: www.youtube.com

The environment, industry and politics play key roles in this story of an old style Soviet mono-town on Lake Baikal.  Monotowns had planned economies that revolved around one industry and today many of these are struggling in the post-Soviet era.  While the particulars of the political situation are a bit dated, the overall issue is still quite relevant to understanding Russia today.   

Tags: Russia, industry, labor, environment, economic, water, pollution, environment modify, unit 6 industry.

The Greatest Invention?

“What was the greatest invention of the industrial revolution? Hans Rosling makes the case for the washing machine. With newly designed graphics from Gapminder, Rosling shows us the magic that pops up when economic growth and electricity turn a boring wash day into an intellectual day of reading.”

Source: www.youtube.com

What one invention has made the greatest difference in the lives of people all around the world?  The case can be made for the washing machine; it has been a major tool in transforming the lives of women and restructuring gender roles in industrialized societies. 

Tags: gapminder, poverty,  gender, technology, industry, development, TED.

Scandinavian Energy Usage

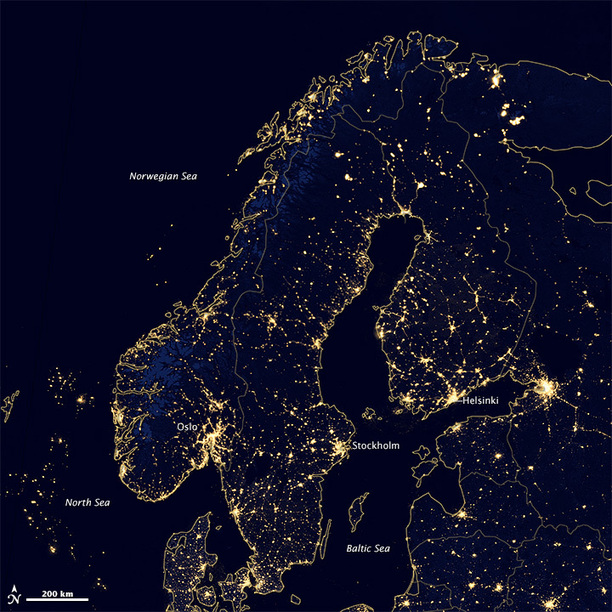
Which countries consume the most electricity per person? You might guess the United States would top the World Bank’s list, but the Nordic countries of Iceland, Norway, Finland, and Sweden are actually at or near the top. Icelanders consume an average of 52,374 kilowatt hours per person per year, Norwegians 23,174 kilowatt hours, Finns 15,738 kilowatt hours, and Swedes 14,030 kilowatt hours. Americans are not far behind, with an average consumption of 13,246 kilowatt hours per person. The Japanese consume 7,848 kilowatt hours.

This image is part of a global composite assembled from data acquired by the Suomi National Polar-orbiting Partnership (Suomi NPP) satellite in 2012. The nighttime view of Earth was made possible by the “day-night band” of the Visible Infrared Imaging Radiometer Suite. VIIRS detects light in a range of wavelengths from green to near-infrared and uses filtering techniques to observe dim signals such as city lights, wildfires, and gas flares. The city lights of several major Nordic cities are visible in the imagery, including Stockholm, Sweden (population 905,184); Oslo, Norway (634,463); Helsinki, Finland (614,074), and Reykjavik, Iceland (121,490).

Tags: Europe, energy, remote sensing, development, Sweden, Finland, Iceland, Norway.

Source: earthobservatory.nasa.gov

Let’s Talk About Geography and Ebola

Why knowing where countries are in Africa matters for how the rest of the world thinks about Ebola.

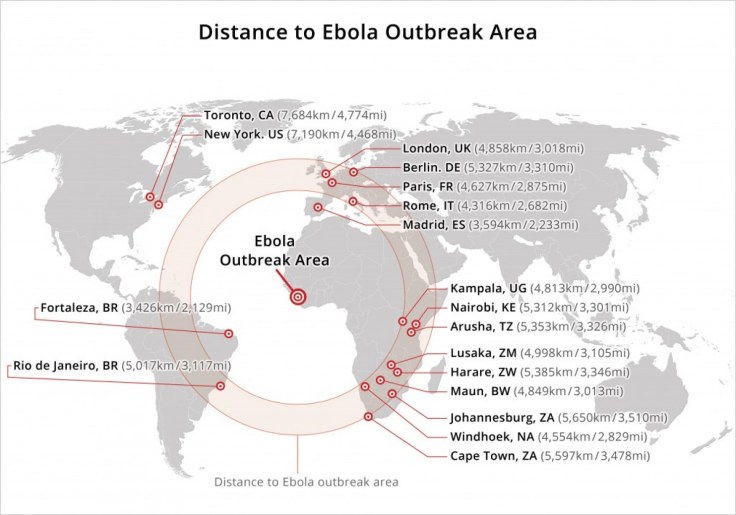
Cultural and media norms that often refer to Africa as one entity rather than an 11.7 million-square-mile land mass comprised of 54 countries and over 1.1 billion people who speak over 2,000 different languages.  This cultural confusion means that, when a dangerous virus like Ebola breaks out, Americans who are used to referring to “Africa” as one entity may make mistakes in understanding just how big of a threat Ebola actually is, who might have been exposed to it, and what the likelihood of an individual contracting it might be.  This Ebola outbreak is wreaking havoc on African economies beyond the three most heavily affected by Ebola, and that damage is completely avoidable. The East and Southern African safari industry provides a good example. Bookings for safaris there — including for the famed Great Migration in Kenya and Tanzania — have plummeted due to the Ebola outbreak. These actions are based in fear, not reality.

Tags: Ebola, medical, diffusion, Africa, regions, perspective.

Source: www.washingtonpost.com

Geographic Influences of Skating

“Dogtown and Z-Boys: A documentary about the pioneering 1970s Zephyr skating team.”

Source: www.youtube.com

Popular culture is shaped by taste-makers, counter-cultural movements, and the blending of cultural practices in new ways creating a distinct aesthetic. Often, the physical geography of a region plays a crucial role in shaping the cultural practices particular to their environment. All of that can be seen quite vividly in the colorful skating revolution of the 1970s that took shape in the Southern California. Kids who grew up idolizing surfers branched out their recreational habits into the modern form of skating that we see today at the X Games. Made legendary through a series of Skateboarder magazine articles, these kids shaped the cultural ethos of skateboarding for over a generation. With the coastal influence of surfing, the socioeconomics of a seaside slum, it’s abandoned piers, the ubiquity of cement and asphalt in the urban landscape, the run-down neighborhood of “Dogtown” was home to cultural movement. The fierce droughts of the 1970 meant abandoned swimming pools; that drought led surfers to the technological infrastructure for modern skating ramps and half pipes as they skated in emptied swimming pools. As stated in those Skaterboarder articles, “two hundred years of American technology has unwittingly created a massive cement playground of unlimited potential. But it was the minds of 11 year olds that could see that potential.” The documentary “Dogtown and Z-Boys” (trailer) and the fictionalized “Lords of Dogtown,” (trailer) both produced by skater turned filmmaker Stacy Peralta, chronicle the age (“Lords of Dogtown” is not appropriate for the K-12 classroom viewing).


Tags: place, space, sport, California, landscape, video, popular culture, music.

How Many Flyover States Does It Take to Equal One New York City?

“Don’t let my New York City–centric comparisons hinder your imagination. The interactive at the top of this page lets you visualize how different parts of the country compare in population density.

Click the button at the bottom of the interactive to select Los Angeles County, for instance, and then click anywhere on the map to generate a (roughly) circular region of (roughly) equal population. The population data come from the 2010 census, and the square mileage was calculated by summing each highlighted county’s total area. You can also use New Jersey (the most densely populated state), Wyoming (the least densely populated state outside of Alaska), Texas, the coasts (the group of all counties that come within 35 miles of either the Atlantic or Pacific oceans), and, yes, New York City as the baseline for your population comparison.”

Tags: cartography, mapping, visualization, urban, density.

Source: www.slate.com

Blog at WordPress.com.

Up ↑