Search

GEOGRAPHY EDUCATION

Supporting geography educators everywhere with current digital resources.

Category

Uncategorized

Teaching September 11th

“In the years after the attacks of September 11, debates about how the United States should respond to the threat of terrorism remain of central importance. The death of Osama bin Laden, the rise of ‘homegrown’ terrorists, and the use of drones to kill suspected terrorists pose new questions and challenges for policy makers and citizens. Responding to Terrorism: Challenges for Democracy helps students consider the issues surrounding the 9.11.01 attacks and the U.S. response to terrorism in a constructive context that promotes dialogue about future policy directions.”

Source: www.choices.edu

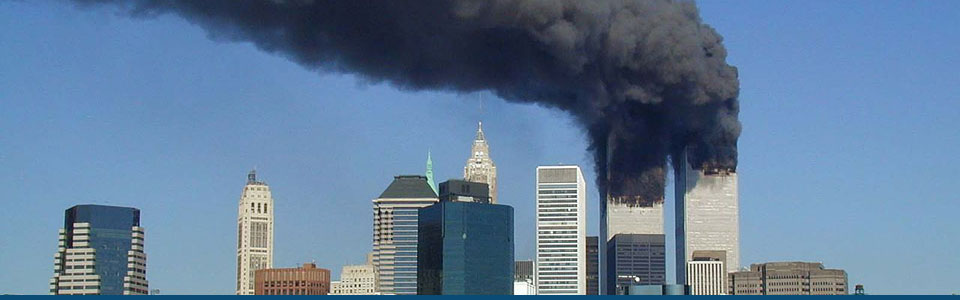
This lesson plan from the Choices Program will help students explore the human dimension of the September 11 attacks as will this lesson from Teaching History. For a geospatial perspective on 9-11, this page from the Library of Congress, hosted by the Geography and Map Division is a visually rich resources (aerial photography, thermal imagery, LiDAR, etc.)  that show the extent of the damage and the physical change to the region that the terrorist attacks brought.  The images from that day are a part of American memory and change how the event is remembered and memorialized in public spaces.  Also on global terrorism, the Choices Program has also produced some materials on how to teach about ISIS as a new emerging geopolitical threat. 

Earth’s Cosmic Context

“Superclusters – regions of space that are densely packed with galaxies – are the biggest structures in the Universe. But scientists have struggled to define exactly where one supercluster ends and another begins. Now, a team based in Hawaii has come up with a new technique that maps the Universe according to the flow of galaxies across space. Redrawing the boundaries of the cosmic map, they redefine our home supercluster and name it Laniakea, which means ‘immeasurable heaven’ in Hawaiian.  Read the research paper here.”

Source: www.youtube.com

Spatial thinking and geographic exploration is constantly seeking to understand place in context to other places.  More often than not, that is done without every venturing beyond this planet, but in many respects, space is the greatest of contexts on the grandest of scales for us to understand ourselves.  I first saw this video embedded in an NPR article and it filled me with wonder to think about the immensities of space and that the Earth is such a small little corner of the universe. 

Tags: space, scale, perspective

America’s coal heartland is in economic freefall

The coal economy in Central Appalachia is in an unprecedented freefall. Which isn’t making it easier for workers to move on.

Source: www.washingtonpost.com

West Virginia and ‘coal country’ are in steep economic decline, but that doesn’t mean people are eager to leave.  Leaving for many is a last resort, but when residents feel a familial and emotional connection to a place–to the land–that can create a rationale for staying that is stronger than economic push factors.  This video set in West Virgina captures the strong sense of place and community that can exist in a place even in in the face of tough times economic prospects. 

Tagseconomicplace, industry, location, migration, APHG, poverty, socioeconomic.

18 “Geography Fail” Media Gaffes

Maps are hard. Not that hard, though.

Source: www.buzzfeed.com

I’ve tried to resist sharing each individual geographic gaffe that the media makes over the years as evidence that we need to strengthen geography education.  Unfortunately, though these media cartographic errors are all to common, geographic ignorance runs much deeper that.  Creating a geo-literate society entails so much more than just knowing where places are on the map…although that is a good start.  


Tags: geo-inspiration, geography education, media.

This is what Louisiana stands to lose in the next 50 years

The USGS says sea-level rise and sinking could claim up to 4,677 square miles of land along the coast if the state doesn’t implement major restoration plans.

Source: projects.propublica.org

This is a gorgeous interactive map which pulls together some high  high quality source materials on a wide range of issues to look at this environmental issues of this region in a holistic manner. 

Tagsmappingcoastal, environment, erosion, landscape.

Deported Mexicans find new life at call centers

“Henry Monterroso is a foreigner in his own country. Raised in California from the age of 5, he was deported to Mexico in 2011 and found himself in a land he barely knew. But the 34-year-old now supervises five employees amid rows of small cubicles who spend eight hours a day dialing numbers across the United States. He is among thousands of deported Mexicans who are finding refuge in call centers in Tijuana and other border cities. In perfect English — some hardly speak Spanish — they converse with American consumers who buy gadgets, have questions about warrantees or complain about overdue deliveries.”

Source: bigstory.ap.org

I have family on both sides of the line; sometimes the border can feel like and artificial an inconsequential separation, at other times it feels like to biggest reality in the region.  This article provides just one intriguing example of how the border both unites and divides economies, peoples, and places.

Tags: Mexicolabormigration, borders, political.    

How Google represents disputed borders between countries

INTERNATIONAL borders are often tricky to chart on maps. Tangible topographic features can be pinned down by satellite imagery but the boundaries between many states…

Source: www.economist.com

I’ve shared some links in the past that some mapping dilemmas with current events in Ukraine.  Google Maps shows international borders differently and National Geographic maps show Crimea as a part of Russia.  In this podcast we learn that this isn’t the only international border dispute that is displayed differently in Google Maps.  Google uses over 30 distinct versions of international borders because there is an underlying geopolitical dimension to cartographyHowever, this article from the Economist is more explicitly geographic in its analysis of the situation and how the discipline(s) of geography/cartography shape the political situation; maps are NOT just a reflection of reality on the ground.  To paraphrase the cartographer Andy Shears, there is a lot of teaching applications and discussion material in these articles. 

Questions to Ponder: Why have different cartography for different audiences?  Why does this small cartographic decision matter? How can maps be used to lie/stretch the truth?  How to governments derive political legitimacy from maps?   Why is Google the cartographic gatekeeper?

Tags: googleUkraine, mapping, borders, political.

Stop Complaining About Gentrification Unless You Know What It Is

“In many cities, it’s become popular to hate ‘gentrifiers,’ rich people who move in and drive up housing prices — pushing everyone else out. But what’s going on in these rapidly-changing urban spaces is a lot more complicated than that.”

Source: io9.com

Gentrification can be a very touchy subject.  What appears to be economic revitalization of a down-trodden neighborhood to one, can appear to be systematic removal of minorities to another.  This op-ed isn’t a whole-hearted embrace of gentrification, but it might be seen as a critique of the gentrification critics.


Tags: neighborhood, gentrificationurban, place, culture, economic.

Where China and Kazakhstan Meet

“While people often say that borders aren’t visible from space, the line between Kazakhstan and China could not be more clear in this satellite image. Acquired by the Landsat 8 satellite on September 9, 2013, the image shows northwestern China around the city of Qoqek and far eastern Kazakhstan near Lake Balqash.

The border between the two countries is defined by land-use policies. In China, land use is intense. Only 11.62 percent of China’s land is arable. Pressed by a need to produce food for 1.3 billion people, China farms just about any land that can be sustained for agriculture. Fields are dark green in contrast to the surrounding arid landscape, a sign that the agriculture is irrigated. As of 2006, about 65 percent of China’s fresh water was used for agriculture, irrigating 629,000 square kilometers (243,000 square miles) of farmland, an area slightly smaller than the state of Texas.

The story is quite different in Kazakhstan. Here, large industrial-sized farms dominate, an artifact of Soviet-era agriculture. While agriculture is an important sector in the Kazakh economy, eastern Kazakhstan is a minor growing area. Only 0.03 percent of Kazakhstan’s land is devoted to permanent agriculture, with 20,660 square kilometers being irrigated. The land along the Chinese border is minimally used, though rectangular shapes show that farming does occur in the region. Much of the agriculture in this region is rain-fed, so the fields are tan much like the surrounding natural landscape.”

Tags: remote sensing, land use, environment, geospatial, environment modify, food, agriculture, agricultural land change.

Source: earthobservatory.nasa.gov

Create a free website or blog at WordPress.com.

Up ↑