Search

GEOGRAPHY EDUCATION

Supporting geography educators everywhere with current digital resources.

Category

Uncategorized

Every Job in America, Mapped

Are you one of the millions of Americans opting into “job sprawl” over a short commute?

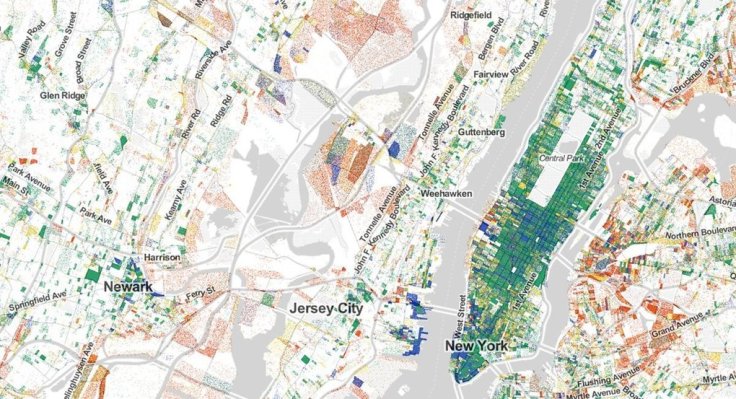
Before you dig in to “Where are the Jobs?: Employment in America 2010,” it may help to note that each dot represents a single job—and you can tell what kind of job it is because of its color. Manufacturing and trade jobs are red; professional services jobs are blue; healthcare, education, and government jobs are green; and retail, hospitality, and other service jobs are yellow. You won’t find any dots for federal jobs (no available data), and Massachusetts is missing entirely—the only state to opt out of reporting its employment trends. The end result is a highly detailed map that gives viewers a quick summary of how many and what types of jobs are a part of the economy.


Tags: economic, labor, USA, transportation, industry.

Source: magazine.good.is

Massive landslides caught on camera

A complete collection of the biggest mudslides and rockslides from around the world.

Source: www.youtube.com

This is a terrifying and mesmerizing compliation that shows the raw power of the Earth.  

Tags: physical, geomorphology, erosion, landforms.

The Atlas of Economic Complexity

“The Atlas is a powerful interactive tool enabling policy makers, entrepreneurs, academics, students and the general public to map the path of diversification and prosperity for 128 countries.  The tool will allow users to explore growth opportunities by country and industry, with the potential to provide input into economic policy and private investment decisions. The analysis may also be used to inform the agendas of development banks in policy recommendations and loan programming; an entrepreneur developing a market plan; an investment promotion agency pitching a new factory, as well as guide other choices we have yet to imagine.” http://wp.me/P2dv5Z-21a

Source: www.youtube.com

This video is an introduction to the Atlas of Economic Complexity; in it they use the visualization tool to analyze the Netherlands’ economy and the cut flower industry.  The Atlas of Economic Complexity is hosted by the Center for International Development at Harvard University (MIT also worked on this project and on their site it is called the Observatory of Economic Complexity).


Tags: developmentindustry, visualization, statistics, economicNetherlandsvideo.

World Religion Map

The incredibly detailed map of the world’s religions shows what the biggest religion is by census area in each country, along with its level of support.

Source: brilliantmaps.com

Mapping religion can be incredibly problematic, but this map (hi-res here) uses the best data available for each country.  Examine some of the regional maps (Asia, Europe, North America, Oceania); what patterns are interesting/surprising to you? 


Tags: culturereligion.

How Chicago became the country’s alley capital

How Chicago became the alley capital of the country and why so much of the rest of the region is conspicuously alley-free.

Source: www.wbez.org

The alley is a reminder of past visions of how to best lay out a city.  In the 19th century, back when Chicago started booming, the city was laid out in a grid and it quickly became a filthy, stinky, disease-ridden place. “Rear service lanes were essential for collecting trash, delivering coal, and stowing human waste — basically, keeping anything unpleasant away from living quarters.”  As we have moved towards curvilinear residential streets and more discrete public utilities, the newer neighborhoods abandoned the alley, but they are still very prominent in old neighborhoods (click here for an interactive map to explore all of Chicago’s alleys). 

Also, Chicago’s suburbs have lofty names (Mount, Heights, Ridge, etc.)  that don’t match this flat topography–read here to find out why.  


Tags: Chicago, urban, placetoponyms, planning, urbanism.

Climate Change Is Here

Record heat, fading ice, and rising seas show how climate change is affecting us. But there’s new hope we can cool the planet. Here’s how.

Source: www.nationalgeographic.com

The National Geographic Magazine has recently created this interactive to accompany the magazine article on climate change (for those worried that the editorial direction would not be as environmentally focused because of the recent changes for the National Geographic Society, I think this is a resounding way for them to emphatically declare that they are committed as ever to their core values and mission).  This interactive is richly-laden with videos, images and case-studies, showing the tangible impacts of climate change and lays out what the future implications of these changes.  The interactive is organized to answer these main questions:

  • How do we know it’s happening?
  • How do we fix it?
  • How do we live with it


Tags: physical, weather and climateenvironment, National Geographic, climate change, water.

The World’s Largest Urban Area Grew Overnight

Rapid growth in several cities along the Pearl River Delta has made a Chinese megacity larger and more populous than any other urban area in the world.

Source: earthobservatory.nasa.gov

What was a rural landscape dominated by rice paddy fields just a few decades ago is now home to the largest Metropolitan region in the world (depending on who is counting and what areas they are including).  The “slider” comparison of these two satellite images taken of the same area in 1988 and 2014 is staggering (click here for an animated GIF of the same imagery).   

Tags: urbanremote sensing, megacities, China, urban ecology.

The Dramatic Landscape of China’s Gansu Province

Gansu Province, in northwestern China, is about the same size as California, with a population of about 26 million people. Gansu’s diverse landscapes include parts of the Gobi Desert, the Yellow River, numerous mountain formations, and remnants of the Silk Road and the Great Wall of China.

Source: www.theatlantic.com

This photo gallery is filled with dozens of great teaching images, displaying the dramatic human and physical landscapes of the Gansu Province of China. 


Tagsimages, landscape, China.

The Geography of E-Waste

The world is increasingly going hi-tech. Many people in our high consumption society want the latest and the greatest; last year’s much anticipated laptops and cell phones are miles behind the newest models that are coming out. So what happens with the old models? Even thrift stores are politely not accepting them as donations. Even some workable machines that were highly valuable 10 years ago are now functionally trash in our society. We can’t put it to the curb to end up in the landfill because of the lead, mercury, and other hazardous materials that can leak into the environment. This type of trash is what we call e-waste. The geography of e-waste is an ‘out of sight out of mind’ problem that we rarely think about but need to due to the ecological impacts of our collective consumption.


Tags: pollutionsustainability, environment, resources, Ghana, Africa.

Source: geographyeducation.org

Create a free website or blog at WordPress.com.

Up ↑