Search

GEOGRAPHY EDUCATION

Supporting geography educators everywhere with current digital resources.

Category

Uncategorized

An earthquake felt across South Asia

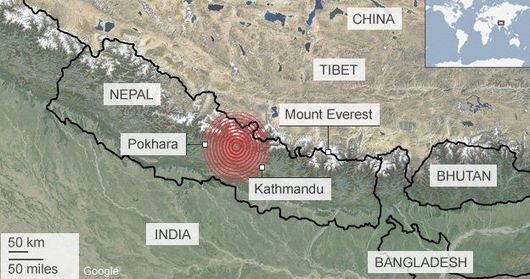
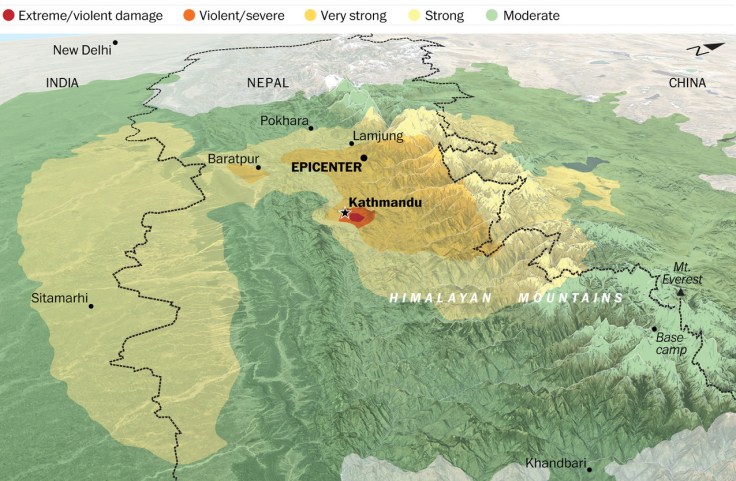
“The magnitude-7.8 earthquake that struck Nepal on Saturday morning destroyed parts of Kathmandu, trapped many people under rubble and killed more than 2,500 people. It was the worst to hit the country since a massive 1934 temblor killed more than 8,000.”

Source: www.washingtonpost.com

Even though we know that with the plate tectonic boundaries where these disasters are more likely to occur, it never fully is expected.  These before and after pictures are heart-rending and full the extent of the damage is hard to comprehend (explore in ArcGIS online).

Geographer Jon Kedrowski has a blog about his mountaineering and expeditions. He is up on Everest now, and his blog has a description of the earthquake and the resulting avalanche. The pictures and descriptions are both sobering and fascinating.

*This post was prepared in collaboration with Dr. Deborah Hann of the Texas Alliance for Geographic Education.


Tags: Nepal, disasters, physical, tectonics.

Earth’s tectonic plates skitter about

“Geoscientists have unveiled a computer model that maps the details of that tectonic dance in 1-million-year increments—practically a frame-by-frame recap of geologic time. It shows that the plates speed up, slow down, and move around in unexpectedly short bursts of activity. It also suggests that researchers may have to rethink what drives much of that incessant motion.  The new model shows that although plates usually creep along at an average speed of about 4 centimeters per year, some can reach much faster speeds in short sprints. For example, India, which broke off the east coast of Africa about 120 million years and is now plowing into Asia, reached speeds as high as 20 centimeters per year for a relatively brief 10 million years.”

Tagstectonicsphysicalgeomorphology, video.

Source: news.sciencemag.org

Seaweed Farms in South Korea

The dark squares that make up the checkerboard pattern in this image are fields of a sort—fields of seaweed. Along the south coast of South Korea, seaweed is often grown on ropes, which are held near the surface with buoys. This technique ensures that the seaweed stays close enough to the surface to get enough light during high tide but doesn’t scrape against the bottom during low tide.

The Operational Land Imager (OLI) on Landsat 8 acquired this image of seaweed cultivation in the shallow waters around Sisan Island on January 31, 2014. Today, about 90 percent of all the seaweed that humans consume globally is farmed. That may be good for the environment. In comparison to other types of food production, seaweed farming has a light environmental footprint because it does not require fresh water or fertilizer.

Source: earthobservatory.nasa.gov

Nepal earthquake: Hundreds die, many feared trapped

At least 970 people have died as Nepal suffered its worst earthquake for more than 80 years, with deaths also reported in India, Tibet and Bangladesh.

Tags: Nepal, disasters, physical, tectonics.

Source: www.bbc.com

Journey to the Center of the Earth

“How far would you have to travel to reach the Earth’s core? And what would you see along the way? Use this BBC interactive to dig into the truth. (BBC).  Download the National Geographic Education high-resolution illustration of Earth’s interior.”

Source: blog.education.nationalgeographic.com

Airport Codes

Making sense of those three-letter airport codes.

Source: airportcod.es

I often fly into CVG (Cincinnati) and wondered why those 3 letters are used as the airport code instead of CIN.  “Serving the greater Cincinnati metro area, Cincinnati/Northern Kentucky’s airport code comes from the nearby city of Covington.”  So why is Chicago ORD and Washington D.C.’s airport IAD?  Airport codes has all the answers to these sorts of questions, but the great circle mapper can help you visualize how these transportation hubs are connected and make fun maps of all your travels.    

Tags: mobility, mapping, transportation.

Social Progress Index

The Social Progress Imperative creates a shared language and common goals to align different organizations and achieve greater social impact.

Source: www.socialprogressimperative.org

I think we all know that we shouldn’t judge a country just by it’s GDP.  Economic development might be correlated with development and social progress, but the outliers are so telling.  In this TED talk, we learn about a new metric designed to measure how well a society provides opportunities for communal and individual success.  Having lived in Costa Rica for two years, I’m not surprised to find that Costa Rica does much better on this index than it would if we were to use GDP or HDI as a way to measure social progress and quality of life. For a more detailed look at the United States, see Geographies of Opportunity: Ranking well-being by Congressional Districts.        

Questions to Ponder: How is the Social Progress Index similar to and different from the Human Development Index?  What assumptions are built into the system? 

Tags: development, statistics, economic, Costa Rica, mapping.

The world’s languages, in 7 maps and charts

“These seven maps and charts, visualized by The Washington Post, will help you understand how diverse other parts of the world are in terms of languages.”

Tags: language, culture, infographic.

Source: www.washingtonpost.com

Stratfor’s Geographic Challenge Video Series

“Stratfor provides geopolitical analysis that is relevant for world regional geography classes, especially their ‘Geographic Challenge’ series. Videos in the ‘Geographic Challenge’ series are symbolized on this map as RED numbered pushpins, and other regional Stratfor videos are BLUE.”  http://arcg.is/1IeK3dT  Also see my map of my favorite geography videos to share in the classroom http://bit.ly/KDY6C2 

Source: www.arcgis.com

I produced this interactive on ArcGIS online to spatially index over 70+ videos from Stratfor, a leader in providing geopolitical intelligence.  This is a great starting point for a student researching a country and some of the issues and challenges that it confronts.       

Tags: mapping, video, ESRIgeography education, geopoliticspolitical.

Blog at WordPress.com.

Up ↑