Search

GEOGRAPHY EDUCATION

Supporting geography educators everywhere with current digital resources.

Category

Uncategorized

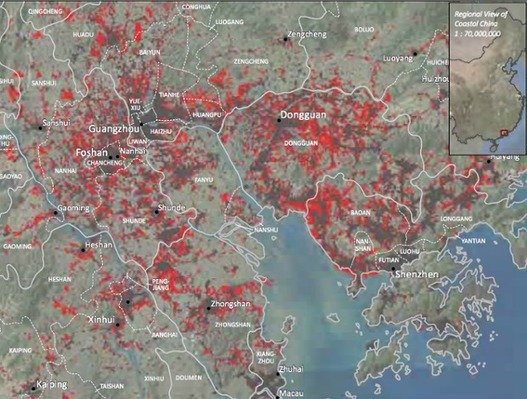
China’s Pearl River Delta overtakes Tokyo as world’s largest megacity

Several hundred million more people are expected to move to cities in East Asia over the next 20 years as economies shift from agriculture to manufacturing and services, according to a World Bank report

Source: www.theguardian.com

Cities in this region have experienced spectacular growth; they are at the heart of China’s manufacturing and exporting boom.  For example, Shenzen was a small city with about 10,000 residents in 1980 but is now a megacity with over 10 million people.  China’s SEZs (Special Economic Zones).  Cities that were once separate entities have coalesced into a large conurbation and if they are counted as one, it’s now the largest metropolitan area.  Cities like London and New York become global cities over hundreds of years–this happened in one generation.  Click here for 5 infographics showing East Asia’s massive urban growth.      

Tags: APHG, urban, industry, manufacturing, economic, unit 7 cities, megacities, China, East Asia.

Folk Culture–Tradition

Source: www.youtube.com

The clip which starts at 0:25 (speaking at 0:50) is an audiovisually rich cultural collage.  Folk cultures are often described as regionally based, nearly homogenous, rural cultures.  These societies are typically dominated by the older generation, traditional, family-based and slow to change.  Folk cultures typically rural, religious, agricultural, family-based and in a word: traditional.  This classic movie’s opening is a good primer for markers of folk cultures and struggles that folk cultures have to maintain there vitality in a globalizing world.  If you continue on in the movie, the actual song Tradition is also rich in explaining how the society maintains itself.  


Tags: Russia, folk cultures, culture, music.

University Re-Imagines Town And Gown Relationship In Philadelphia

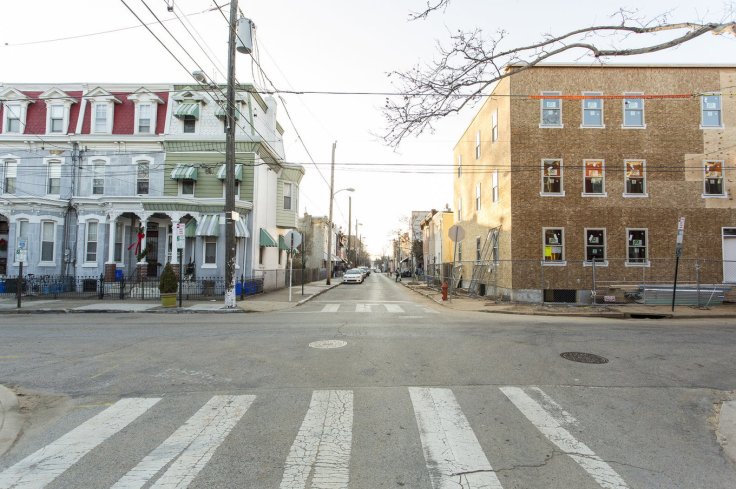
Drexel University is taking a hands-on approach to redeveloping one of Philadelphia’s poorest neighborhoods with a new center designed to serve not just students but mainly local residents.

Source: www.npr.org

This NPR podcast shows a good example of an urban revitalization project that is actively trying to avoid following the gentrification path.  Growing colleges can unintentionally displace longtime residents, but this project is about preserving the cultural fabric of the neighborhood and building good will in the community. 

Tags: neighborhoodpodcast, gentrificationurban, place, culture, economicracepoverty.

1940s Urbanism

“This is a film by the Chicago Board Of Education, produced sometime in the 1940s. This film could have been geared towards tourism or to entice companies to come to Chicago or used in the classroom.  The great thing about this film reel, is all the different views of the city they give.”

Tags: Chicago, urban, place, landscape,  video, urbanism.

Source: vimeo.com

Geography Education on Tumblr

Source: geographyeducation.tumblr.com

You can now get your ‘Geography Education’ on Tumblr, if that is a social media platform that you use. 

4 animations that show what’s really going on with our climate

“Trying to understand what’s actually going on in the world’s climate seems like it might be truly impossible. For one thing, there are so many different factors at work. Everything from how light travels through the atmosphere to how the winds move the ocean around to how rain hits the ground has an effect on what actually happens on Earth both now and in the future. That also means there’s absolutely no use in looking at each piece individually … to understand what’s really going on, the climate jigsaw puzzle needs to be complete.

That, says climate scientist Gavin Schmidt, is where climate modeling comes in. The discipline synthesizes data from multiple sources, including satellites, weather stations, even from people camping in the Arctic and submitting measurements of the ice they see around them. Climate modeling, Schmidt says, gives us our best chance of understanding the bigger picture of the world around us. ‘We take all of the things we can see are going on, put them together with our best estimates of how processes work, and then see if we can understand and explain the emergent properties of climate systems,’ he says. These four silent animations show what he means.”

Tags: physical, weather and climate, Arctic, Antarctica, climate change.

Source: ideas.ted.com

Worldwide Country Comparison

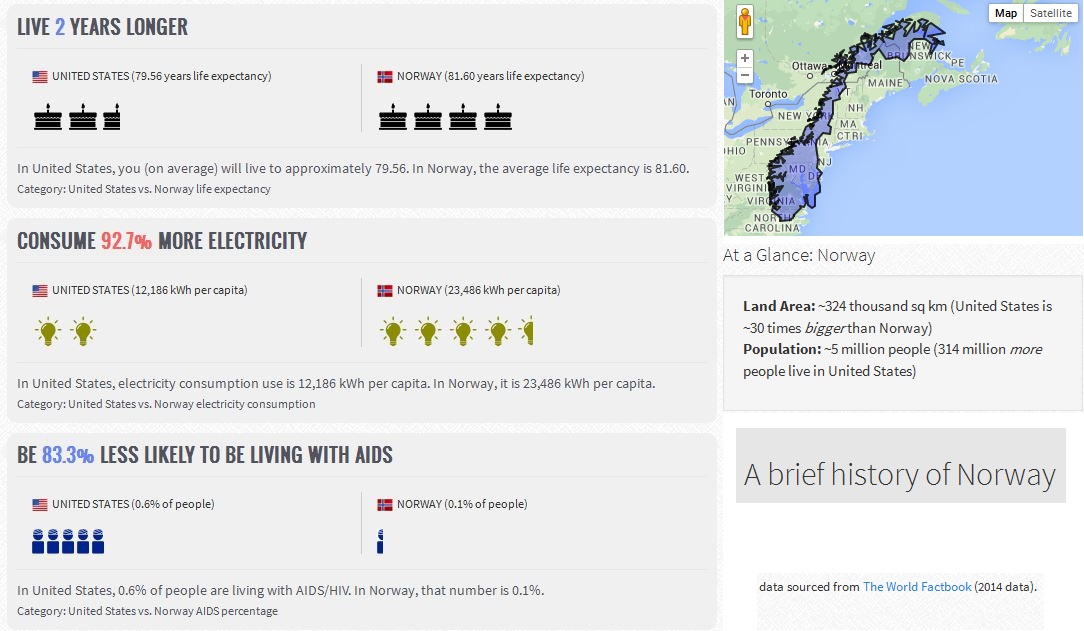
MyLifeElsewhere allows you to compare your home country with different countries around the world. Ever wonder what your life would be like if you were born somewhere else?”

Source: www.mylifeelsewhere.com

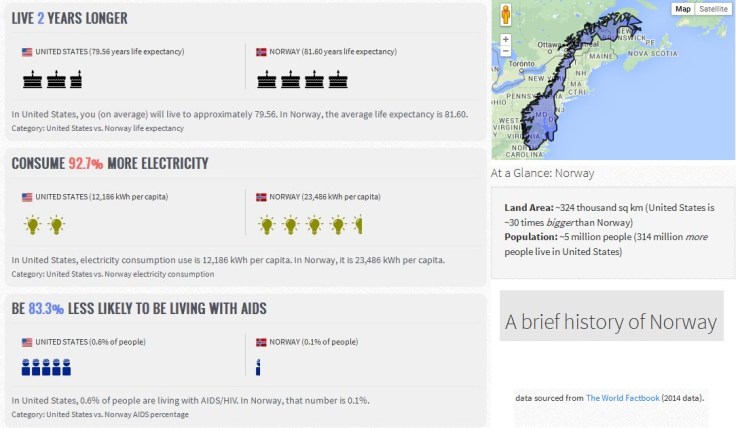
Did you know that with 1/30th the territory of the United States, Norway still has over 25% more coastline?  I didn’t either until I compared Norway to the United States using My Life Elsewhere.  This site is designed allow United States students to imagine how their lives might be different if they were born in a different part of the world.  Student would probably die 21 years earlier if they were born in Liberia and 11 times more likely to have died in infancy.   Students would be 43.8% less likely to grow up and be unemployed and have 36.3% less babies if they were born in Taiwan.  This side-by-side format is a great way to help students help make these statistics real and meaningful.  One major drawback: this site only allows users to compare a country to the United States.  If you prefer to have students compare, say Cuba to the United Arab Emirates, I would recommend that you try If It Where My Home.

Tags: comparison, worldwide, statistics, development.

Finding and Using Spatial Data Sources

“Data is great, but working with numbers can be intimidating. We have more data than ever before that is available to us, and graphs, charts, and spreadsheets are ways that data can be shared. If that data has a spatial element to it, the best way to visualize a large dataset might just be a map.”

Source: blog.education.nationalgeographic.com

I hope you enjoy this article I wrote about GeoFRED, a way to visualize economic statistics.  All of my future articles for National Geographic Education will be archived here at this link

Tags: National Geographicdevelopment, statistics,  economic, mapping.

How American Agriculture Works

There really are two different Americas: the heartland, and the coasts….

Source: www.huffingtonpost.com

These maps together show that most of the grain from the American breadbasket does not directly on the table but into the feed trough.  I imagined before I saw this data that the percentage of animal feed in the Midwest would be higher than the rest of the United States, but I would not have guessed that it was that high. 


Tagsfoodeconomicfood production, agribusiness, agriculture.

Blog at WordPress.com.

Up ↑