Search

GEOGRAPHY EDUCATION

Supporting geography educators everywhere with current digital resources.

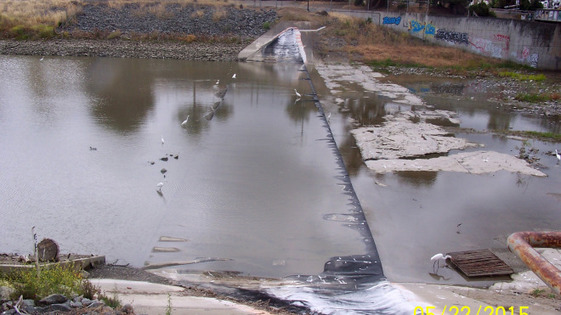
Vandals destroy dam, release 49 million gallons of water into Bay

Fremont police say vandals attacked an inflatable dam on Alameda Creek that resulted in the loss of nearly 50 million gallons of water.

Source: kron4.com

Because what’s more fun than losing nearly 50 millions gallons of freshwater during a drought?  The selfishness of some can be so disheartening for the rest of the community. 

Customizable Maps of Mexico

“Find worksheets about Geography of Mexico.  Hundreds of worksheets–millions of combinations.”

Source: www.worksheetworks.com

One of the problems with so many outline maps for classroom use is that, depending on your lesson plan, you might want it labeled, showing surrounding countries or in color…but maybe not.  This site let’s you customize these simple maps that are perfect for the K-12 classroom (and yes, they have maps for all regions of the world).  


Tags: Mexico, K12, map, map archives. 

Plate Tectonics and the Formation of Central America and the Caribbean

This animation is made from a time series of maps reconstructing the movements of continental crust or blocks, as South America pulled away from North America, starting 170 million years ago. Note that South America is still clinging to Africa at the beginning of the series.

Source: www.youtube.com

The land bridge connecting North and South America is hardly permanent (on a geological time scale that is).  This video is an animated version of the still maps from this article.  

Tags: Mexico, tectonics, physical, video, Middle America.

Urban Farmers Say It’s Time They Got Their Own Research Farms

The University of the District of Columbia is the one land-grant university in the U.S. with an urban focus. It’s leading research on growing food in raised beds, hoop houses and shipping containers.

Tags: agriculture, food, urban, unit 5 agriculture. 

Source: www.npr.org

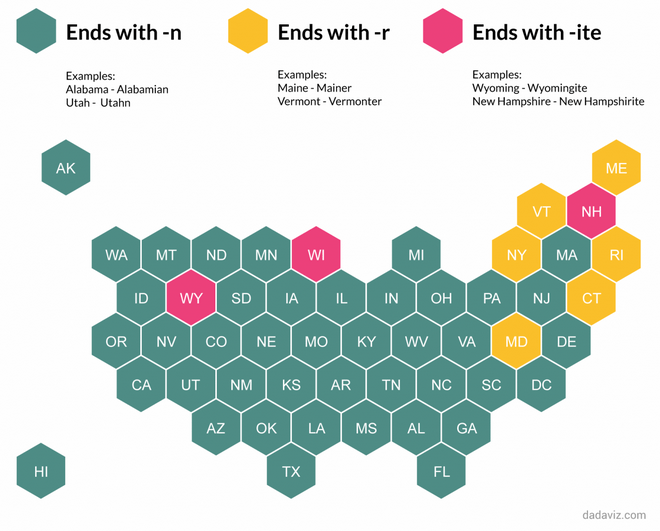
Utahns, Mainers and Wyomingites: The ultimate guide to what to call people from each state

“For most states, you’re safe adding an –n, and maybe a few other letters, to the state’s name – a la Coloradans, Nebraskans and Californians. For three states, Wyoming, Wisconsin and New Hampshire, the correct method is to add an –ite. For a handful of states in the northeast, the style is to add an ‘r’ – New Yorker, Vermonter, Mainer, Marylander, Connecticuter and Rhode Islander.”

Source: www.washingtonpost.com

Having lived in New England for 6 years now, I still haven’t found a polite term to refer to people from Massachusetts.

Map Projections

This video describes what map projections are, and how the Earth can be represented using map projections within a GIS.

Tags: Mapping, video, map projections, cartography.

Source: www.youtube.com

The Anatomy of a Tornado

Jim Cantore gives an INCREDIBLE step-by-step description and 3D view into how a tornado forms – like you’ve never seen before!

Tags: physical, weather and climate, visualization.

Source: www.youtube.com

The Chinese Art of the Crowd

After viewing news photographs from China for years, one of my favorite visual themes is “large crowd formations.” Whether the subject is military parades or world-record attempts, mass exercises or enormous performances, the images are frequently remarkable. The masses of people can look beautiful or intimidating, projecting a sense of strength and abundance. Individuals can become pixels in a huge painting, or points on a grid, or echoes of each other in identical uniforms or costumes.


Tags: China, East Asia, culture, art, landscape.

Source: www.theatlantic.com

Before-and-after maps show how freeways transformed America’s cities

Beginning in the 1950s, cities demolished thousands of homes in walkable neighborhoods to make room for freeways.

At the time, this was seen as a sign of progress. Not only did planners hope to help people get downtown more quickly, they saw many of the neighborhoods being torn down as blighted and in need of urban renewal.  But tearing down a struggling neighborhood rarely made problems like crime and overcrowding go away. To the contrary, displaced people would move to other neighborhoods, often exacerbating overcrowding problems. Crime rates rose, not fell, in the years after these projects.  By cutting urban neighborhoods in half, planners undermined the blocks on either side of the freeway. The freeways made nearby neighborhoods less walkable. Reduced foot traffic made them less attractive places for stores and restaurants. And that, in turn, made them even less walkable. Those with the means to do so moved to the suburbs, accelerating the neighborhoods’ decline.

Source: www.vox.com

Later this month I will be in Cincinnati (pictured above) and will see firsthand some of the urban changes that freeways have had on the landscape, neighborhoods, and the lives of residents.  This article has some “swipe” aerial photography on Cincinnati, Detroit, and Minneapolis for your analysis. 

Tags: urban, transportation, planning, historical, urban models, APHG, neighborhood, Cincinnati. 
Blog at WordPress.com.

Up ↑