Search

GEOGRAPHY EDUCATION

Supporting geography educators everywhere with current digital resources.

Satellites Reveal Sudden Greenland Ice Melt

See on Scoop.itGeography Education

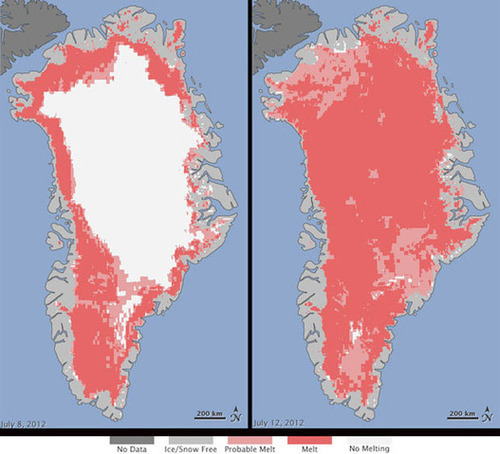
NASA researchers are expressing concern about something they’ve never seen before: the melting of ice across nearly the entire surface of Greenland earlier this month.

Climate changes are afoot in the Arctic and the Greenland ice sheet.

In related news, Texas and Louisiana have introduced education standards that require educators to teach climate change denial as a valid scientific position. South Dakota and Utah passed resolutions denying climate change. Tennessee and Oklahoma also have introduced legislation to give climate change skeptics a place in the classroom.

See on www.theworld.org

Hijab: A Different Definition of Freedom

See on Scoop.itCultural Geography
Hijab: A Different Definition of Freedom http://t.co/WzAFA5Fv...

The meaning you ascribe to a cultural artifact is inherently based on your cultural perceptions and values.  While many in the West perceive the hijab to be a symbol of male hegemonic power and female oppression.  In this article that defends the Hijab, it is presented as a distinct form of female liberation.

See on www.moroccoworldnews.com

U.S. AID education/poverty infographic

See on Scoop.itGeography Education

An excellent infographic that highlights the importance of education in the process of fighting poverty.  Why is education (especially women) so pivotal for development?  Should this change how we think about humanitarian aid?       

See on 50.usaid.gov

India’s Census: Lots Of Cellphones, Too Few Toilets

See on Scoop.itGeography Education

The results of India’s once-in-a-decade census reveal a country of 1.2 billion people where millions have access to the latest technology, but millions more lack sanitation and drinking water.


More Indians are entering the middle class as personal wealth is transforming South Asia’s economy in the private sector.  Yet the government’s ability to provide public services to match that growth still lags behind.  Why would it be that it is easier to get a cell phone than a toilet in India?  What will that mean for development?  

See on www.npr.org

Bridging the Digital Divide

See on Scoop.itGeography Education


This is an inspiring project that seeks to elevate poor slum-dwelling Indians by providing educational resources to children.  As free computer terminals are made available, their literacy skills soar and possibilities are widened.  Visit the projects homepage at: http://www.hole-in-the-wall.com/

See on www.youtube.com

Containerization Shaped Globalization

See on Scoop.itGeography Education

Sometimes a single unlikely idea can have massive impact across the world. Sir Harold Evans, the author of They Made America, describes how frustration drove…

The economies of scale that globalization depends on, relies on logistics and transportation networks that can handle this high-volume.  In a word, the container, as mundane as it may seem, facilitated the era within which we live today.

See on www.youtube.com

Ignite Education: On Demand Learning

See on Scoop.itGeography Education

“I want to contrast this ‘on demand’ learning from typical classroom learning…below are three examples of how an educator might include ‘on demand’ learning within a geography or GIS course.” 


In this article (from a excellent geography/GIS education blog), the three main ways to use on-demand learning are: 1) Project-based work  2) Flipped Classroom and 3) Creating a Learning Resource.  All three are designed to use technology within the classroom (with geographic content especially). 

See on blog.abs-cg.com

Amazing animated infographic look at various world

See on Scoop.itGeography Education

Amazing animated infographic look at various world statistics in Oceania vs. Europe vs. America vs. Africa vs. Asia, from population to homicides to number of billionaires – a fine example of how to…


The video doesn’t have captions to denote which continent is which, otherwise this is an excellent  data visualization of global and regional differences, using the theme of the Olympics as it’s symbolic motif. 

See on exp.lore.com

Lives on the Line

See on Scoop.itGeography Education

As mentioned by the cartographers of this London map, maps have a way of highlighting the social inequalities especially at the neighborhood scale in the urban environment.  Each ward (census tract is colored according to child poverty rates, and the numbers represent life expectany rates in the neighborhood near each underground stop.

See on life.mappinglondon.co.uk

Create a free website or blog at WordPress.com.

Up ↑