Search

GEOGRAPHY EDUCATION

Supporting geography educators everywhere with current digital resources.

Amarnath: Journey to the shrine of a Hindu god

See on Scoop.itRegional Geography

Each year, Hindu devotees make a pilgrimage to the sacred Amarnath Cave, one of the most revered Hindu shrines, near Baltal, Kashmir, India.


With 46 stunning images, this is a great visual glimpse into the a traditional pilgrimage deep into the Himalayas.   

See on www.boston.com

How to Create Your Own Textbook — With or Without Apple

See on Scoop.itSocial Media Classroom

Aggregation, curation, creation: A step-by-step guide to creating your own textbook — and involving your students along the way.


Textbooks are fantastic compilations of educational resources.  Online publishing of resources is now much more accessible to professors and teachers that  want to craft their own course resources.

See on blogs.kqed.org

Map of America’s Hispanic population

See on Scoop.itGeography Education

In the race to the White House, no ethnic group is more prized than Hispanics. President Obama ended deportations for some young undocumented immigrants, and the Romney campaign is vetting Sen.


This interactive map feature combines to interesting variables (at the county level): the percentage of the total population that is Hispanic, and the 2008 presidential election.  Analyze your local area and a few counties as well.  What connection exists between the two variables?  How come?  What are some exceptions to these general patterns?

See on www.slate.com

A Nation Of Meat Eaters: See How It All Adds Up

See on Scoop.itGeography Education

Americans eat more meat than almost anyone else in the world, but habits are starting to change. This may be in part because of health and environmental concerns. We explore some of the meat trends and changes in graphs and charts.

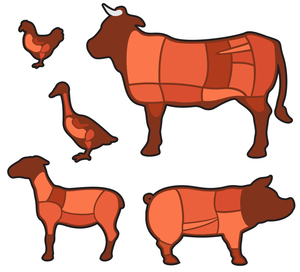
Often we hear about the dietary impact of meat consumption at the personal scale, but what are the environmental impacts of heavy meat consumption on a global scale?  Not all meats have the same environmental impact (beef is much less environmentally efficient than chicken, pork or turkey).   As globalization has spread, American cultural preferences have changed worldwide taste preferences.  As the global population rises, the impact of meat consumption is now a major environmental concern.

See on www.npr.org

Understanding Poverty in the United States

See on Scoop.itGeography Education

Analysis of poverty in the USA: poor children rarely hungry; poor often have cable TV, air conditioning, a computer, and larger homes than non-poor Europeans.


This is an interesting series of bar graphs, pie charts and other data sets, all showing helping us to contextualize the life of the poor.  How is ‘being poor’ in the United States distinct from poverty in other regions of the world?  Is it fair to distinguish between the two?  How do you define poverty?  Is it a universal standard that is the same everywhere or is it a relation measure compared to others within the community? 

See on www.heritage.org

Gerrymandering 101

See on Scoop.itGeography Education


This video is a good primer to show before the ReDistricting Game (http://www.scoop.it/t/geography-education/p/2214122954/the-redistricting-game ).

See on www.youtube.com

The ReDistricting Game

See on Scoop.itGeography Education

This is an interactive way to teach the importance of the redistricting process.  Mapmakers (and geography) are crucial to the process.  This game shows students how the process can be manipulated and if you understand local demographics and voting patterns, subtle shifts in the district borders can swing elections.  This is a great way to teaching gerrymandering and how political cartography can be.     

See on redistrictinggame.org

Using a Smartphone and ArcGIS Online

See on Scoop.itGeography Education

“Now that it is easy to gather tracks and waypoints on a smartphone and map them in a GIS, it provides a good opportunity to remind students about the importance of being critical of and paying attention to data. I recently went on a walk around a local reservoir and used the Motion X GPS app on my iPhone to collect my track and a few waypoints. I emailed the data to myself and added the GPX file to ArcGIS Online so I could map and examine the track. I made my results public and made it visible below to feature some teachable moments……”

See on blogs.esri.com

8 Amazing Drowned Buildings

See on Scoop.itGeography Education

The majority of these ‘drowned buildings’ are the direct result of decisions to dam a river and create a reservoir, create hydroelectricity, etc.  How should we analyze this type of cultural landscape?  What does it ‘say’ about the multiple groups that have contributed to this layered, complex landscape?  Pictured here is the St. Nicolas Church in Macedonia, an 1850 building that is losing to the unrelenting 2003 reservoir that at times fully submerges the building.     

See on www.theworldgeography.com

Create a free website or blog at WordPress.com.

Up ↑