Search

GEOGRAPHY EDUCATION

Supporting geography educators everywhere with current digital resources.

Tag

environment depend

Ethiopia’s Dam Problems

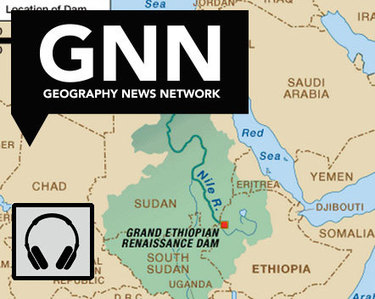
“Ethiopia is three years from completing a dam to control its headwaters, and while Egypt points to colonial-era treaties to claim the water and to stop the project, the question remains as to who own the Blue Nile.”

Source: maps101blog.com

This 7-minute Geography News Network podcast (written by Julie and Seth Dixon) touches on some key geographic concepts.  85% of the Nile’s water comes from the Blue Nile that originates in the Ethiopian highlands–it is the Blue Nile that Ethiopia has been working on damming since 2011.  The Grand Ethiopia Renaissance Dam (GERD) will be located  near the border with Sudan.  Egypt is adamantly opposed to Ethiopia’s plan and is actively lobbying the international community to stop construction on the dam, fearing their water supply with be threatened. 

Tags: Ethiopia, Africa, development. environment, water, energy, borders, political.

This 19th Century Map Could Have Transformed the West

Today’s drought-riven west would look very different if Congress had listened to John Wesley Powell

Source: www.newrepublic.com

Author of Mapping the Nation, Susan Schulten explains how western expansion failed to recognize the basic physical geographic reality of the United States–that the west is much drier than the east.  Given that much of the west, especially California, is in the midst of a severe drought, this article serves as a reminder to recognize that localized understandings of human and environmental actions are necessary.  Do you know what watershed you live in?  How does and should that impact us?   


Tags: physical, historical, California, water, environment.

America’s recent drought history, animated

“California’s drought just hit a new milestone: As of this week, 32.98 percent of the state is experiencing “exceptional” drought, making it the worst drought in the 14 years that the Department of Agriculture’s Drought Monitor has tracked data.”

Source: www.washingtonpost.com

The recent drought in California has only deepened and this Washington Post article shows an animated map that highlights the temporal and spatial patterns in the drought data (hint–it’s not pretty).  In a related note, May 2014 was the hottest May in recorded history.     

Questions to Consider: What are some reasons (both from human and physical geography) for this severe drought? What can be done in the short-term to lessen the problem? What can be done to make California’s water situation better for the next 50 years?

Tags: physical, weather and climate, consumptionCalifornia, water, environment, resources, environment dependurban ecology.

Create a free website or blog at WordPress.com.

Up ↑