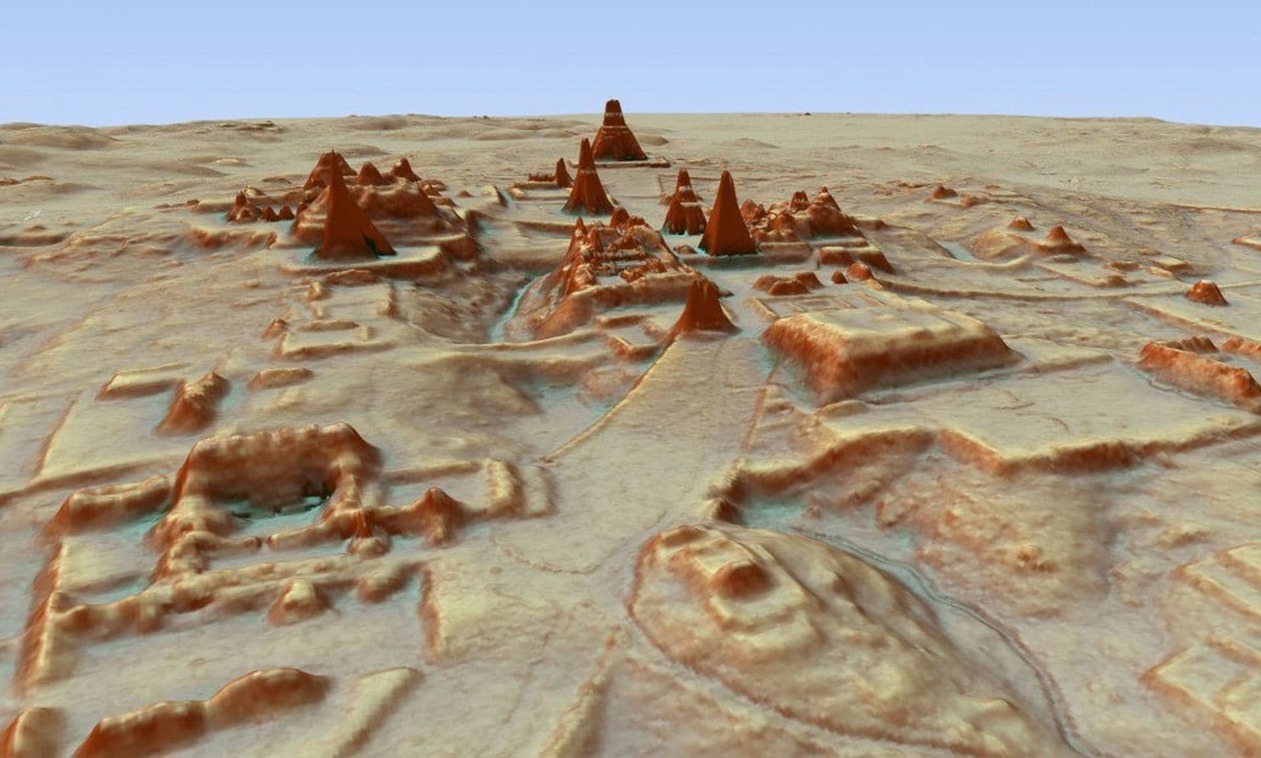
Archaeologists have spent more than a century traipsing through the Guatemalan jungle, Indiana Jones-style, searching through dense vegetation to learn what they could about the Maya civilization. Scientists using high-tech, airplane-based lidar mapping tools have discovered tens of thousands of structures constructed by the Maya: defense works, houses, buildings, industrial-size agricultural fields, even new pyramids. SOURCE– National Geographic: Everything we thought we knew about the Maya is being upended
Lidar technology gives us the visual answer to the question, “If you were to strip a forest of all its vegetation, what would you see? The lidar system fires rapid laser pulses at surfaces and measures how long it takes that light to return to sophisticated measuring equipment. Doing that over and over again lets scientists create a topographical map of sorts. Months of computer modeling allowed the researchers to virtually strip away half a million acres of jungle that has grown over the ruins. What’s left is a surprisingly clear picture of how a 10th-century Maya would see the landscape.
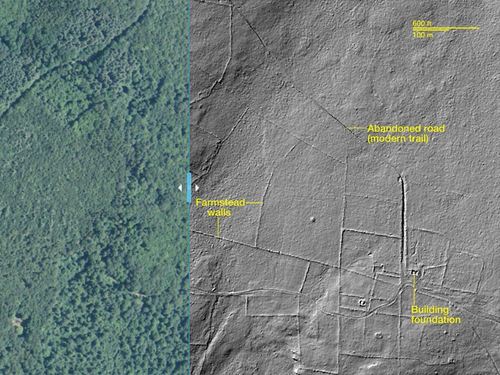
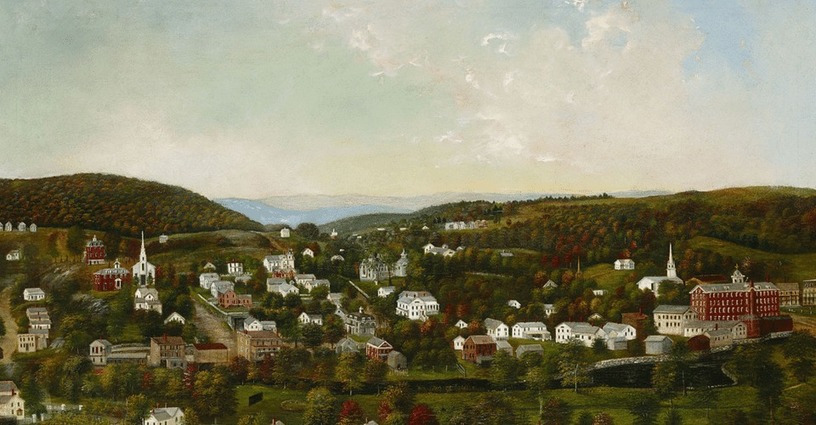
This technology also has local applications here in New England. New England’s wooded hills hold a secret—they weren’t always forested. Instead, many were once covered with colonial roads and farmsteads and food production was the primary local economic activity. Today we can use lidar to see remnants of this historical landscape by mapping stone walls and other features. SOURCE–National Geographic: Lost New England revealed by high-tech archaeology
ArcGIS application: Lidar can also be used quickly assess damage and change after a geologically violent incident, as seen in the Oso landslide in Washington state. View the impact in ArcGIS online in this ArcGIS map, utilizing LiDAR I and II data layers.
Questions to Ponder:
- How does lidar work?
- How can it be used in GIS?
- What are 2 changes to our understanding of the Maya that come out of this Lidar data?
- What are 2 New England applications that you found interesting?
- Examine the Oso landslide in ArcGIS online. How does this visual representation change your understanding?