Search

GEOGRAPHY EDUCATION

Supporting geography educators everywhere with current digital resources.

Tag

physical

Pros and Cons of Cotton Production in Uzbekistan

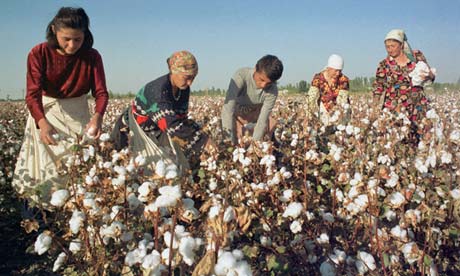
“This case study considers the pros and cons of cotton production in Uzbekistan. Since the country’s independence from the Soviet Union in 1991, revenues from cotton taxation have contributed substantially to developing the industrial sector, boosting the current account, achieving energy and food-grain self-sufficiency, and buffering domestic shocks in food and energy prices. Nonetheless, some argue that the state procurement system hampers the development of the agricultural sector. Often the payments for cotton hardly cover farmers’ production costs, and the quasi mono-culture of cotton production has adversely affected environmental sustainability.”

Source: cip.cornell.edu

Uzbekistan is a top world producer and exporter of cotton. There are many sectors involved in managing the cotton commodity chain to partake in the production. Not only is it a source of income, but provides labor jobs and food consumption. However, the land where the cotton production takes place is suffering. This land faces many types of land degradation that has an impact on the cotton. In order to secure the land, there are possible solutions and policies to improve the agriculture and the cotton benefits. Once the world’s fourth largest lake, the Aral Sea, is located in Uzbekistan, and has had a major impact on the cotton industry. This production has given Uzbekistan a world-wide reputation in cotton production, but is also known for destroying one of the world’s largest lakes.  Just because it is your greatest economic competitive advantage, doesn’t mean that it is environmentally sustainable.


Questions to Ponder: How much does the cotton production contribute to Uzbekistan economically? What are the solutions to address the demising Aral Sea? Who is impacted the most because of the land issues?


Tags:  agriculture, labor, Uzbekistan, physical, weather and climateland use, environmentAral Sea.

How Geospatial Analytics Are Changing Habitat Conservation

“The BirdReturns program is an effort to provide ‘pop-up habitats’ for some of the millions of shorebirds, such as sandpipers and plovers that migrate along the Pacific Flyway, a route that spans from Alaska to South America. Birds flying on this journey seek out the increasingly rare wetlands teeming with tasty insects to fuel their long-distance flights.  Over the last century, California’s Central Valley has lost 95% of the wetlands habitat to development, agriculture, and other land use changes. As a solution, scientists use big data, binoculars, and rice paddies.”

Source: www.youtube.com

This project combines data from satellite imagery to map surface water in California’s Central Valley, and individual bird observations to select locations that can be temporarily converted into wetlands to aid the migratory birds (for more information than the video provides about this project, read this article). 


This is a great example of using both ‘big’ geospatial data as represented by the satellite imagery and combining it with field data and actual observations to make the world a better place.  We need more decision makers that can think spatially and use geographic skills.  


Tags: physicalCalifornia, water, environmentbiogeography, remote sensing.

Volcanic ash covers Costa Rica towns

A volcano erupts in central Costa Rica, belching smoke and ash up to 3,000m (9,840ft) into the air and choking nearby communities.


Tags: Costa Rica, disasters, physical, volcano.

Source: www.bbc.com

Yes, Yellowstone’s Roads Just Melted. No, There’s No Reason to Panic

“Last week, a major tourist thruway in Yellowstone National Park had to be shut down because the road melted. The road’s Wicked Witch of the West impression was caused by high temperatures in both the air and under the ground. Yellowstone sits atop a volcanic hotspot, and that heat helped cause the asphalt to soften and oil to well up onto the surface.”

Source: www.smithsonianmag.com

China’s hungry cattle feasting on alfalfa grown on Utah farm

China has long depended on the U.S. breadbasket, importing up to $26 billion in U.S. agricultural products yearly. But increasingly, Chinese investors aren’t just buying from farms abroad. They’re buying the farms.

Source: www.mcclatchydc.com

Globalization is often described as a homogenizing force, but is also pairs together odd bed fellows.  A small Utah town near the Colorado border, Jensen is now home to the largest Chinese-owned hay farm in the United States. Utah’s climate is right for growing alfalfa, and China’s growing cattle industry make this a natural global partnership.  Large container ships come to the United States from China, and return fairly empty, making the transportation price relatively affordable.  Locally back in the United States though, water resources are scarce and many see this as a depletion of local water exported to China.  Some states see this as a threat and are considering banning foreign ownership of farmland.  This article shows the merging various geographic themes: the global and local, the industrial and the agricultural, the human and the physical.         

Tags: agriculture, agribusinesstransportation, globalizationwaterChinaindustry, economic, physical, Utah.

This 19th Century Map Could Have Transformed the West

Today’s drought-riven west would look very different if Congress had listened to John Wesley Powell

Source: www.newrepublic.com

Author of Mapping the Nation, Susan Schulten explains how western expansion failed to recognize the basic physical geographic reality of the United States–that the west is much drier than the east.  Given that much of the west, especially California, is in the midst of a severe drought, this article serves as a reminder to recognize that localized understandings of human and environmental actions are necessary.  Do you know what watershed you live in?  How does and should that impact us?   


Tags: physical, historical, California, water, environment.

Maximum Summer Heat

A new analysis shows when summer reaches peak heat across the U.S.

Tags: physical, weather and climate, seasonal.

Source: www.climatecentral.org

America’s recent drought history, animated

“California’s drought just hit a new milestone: As of this week, 32.98 percent of the state is experiencing “exceptional” drought, making it the worst drought in the 14 years that the Department of Agriculture’s Drought Monitor has tracked data.”

Source: www.washingtonpost.com

The recent drought in California has only deepened and this Washington Post article shows an animated map that highlights the temporal and spatial patterns in the drought data (hint–it’s not pretty).  In a related note, May 2014 was the hottest May in recorded history.     

Questions to Consider: What are some reasons (both from human and physical geography) for this severe drought? What can be done in the short-term to lessen the problem? What can be done to make California’s water situation better for the next 50 years?

Tags: physical, weather and climate, consumptionCalifornia, water, environment, resources, environment dependurban ecology.

Blog at WordPress.com.

Up ↑