Search

GEOGRAPHY EDUCATION

Supporting geography educators everywhere with current digital resources.

Tag

population

Human Population Through Time

It took 200,000 years for our human population to reach 1 billion—and only 200 years to reach 7 billion. But growth has begun slowing, as women have fewer babies on average. When will our global population peak? And how can we minimize our impact on Earth’s resources, even as we approach 11 billion?

Source: www.youtube.com

As stated in a Vox article, “The video above, from the American Museum of Natural History, shows essentially all of human history in just six minutes. It shows humanity spreading across the world over a few hundred thousand years — even as our population remained under 1 million. After that came the rise and fall of many empires and civilizations, plagues, wars, and so on — all the way to our current population of around 7 billion.”  Admittedly, the video is a bit “slow” in the middle, but that is a major part of the story of human population growth, and only serves to show how dramatic the population growth is at the end.  This video brings up more questions than it has answers.


Tags: demographicsmappingmigration, populationhistorical, unit 2 population 

Why Malthus Is Still Wrong

Why Malthus makes for bad science policy

Source: www.scientificamerican.com

The ideas of Thomas Malthus have always loomed large; the scope includes some of the biggest issues facing humanity’s continued existence on this planet.  His controversial ideas have been debated and inspired some policies that were especially damaging.  This anti-Malthusian op-ed was written by the Publisher of Skeptic Magazine; I typically pair this with the neo-Malthusian op-ed written by the  President of the Canada’s Population institute.  Comparing and contrasting the merits of these articles provides a way to get student to assess the strengths of an argument and to identify the bias/perspective of the author.  


Questions to Ponder: What did Malthus get right?  What did he get wrong? 


Tagsop-ed, demographics, population, APHG, unit 2 population

‘Leftover Women’ in China

“Chinese women face immense pressure to get married before they turn 27. In many Chinese cities, so called marriage markets are a common sight, where parents go to post and match personal ads. A number of brave Chinese women have finally stood up to speak their mind against society’s labels and their parents’ pressures.”

Source: www.youtube.com

This emotional ad about ‘leftover women‘ in China has received a lot of traffic and is now invigorating a national conversation about marriage customs, gendered norms, and cultural expectations.  What isn’t as explicit in the video is how demographic policies and cultural preferences for boys has created the situation that puts added pressure on single women


Questions to Ponder: How is this (at least partially) a lingering impact of the One Child Policy?  What traits of traditional Chinese culture led to this current situation?   


Tags: gender, folk culture, China, culture, population.

Why China and India face a marriage crisis

“What has lead to this marriage squeeze?  First, millions women have gone ‘missing’. A generation ago, a preference for sons and the greater availability of prenatal screening meant first Chinese couples, then Indian ones, started aborting female fetuses and only giving birth to boys. At its extreme, in parts of Asia, more than 120 boys were being born for every 100 girls. Now, the generation with distorted sex ratios at birth is reaching marriageable age. The result is that single men far outnumber women.”


Tags: gender, ChinaIndia, culture, population.

Source: www.youtube.com

DON’T PANIC — Hans Rosling showing the facts about population

Source: www.youtube.com

Over the years I’ve shared many video clips featuring Hans Rosling and the Gapminder resources (click here for archived links).  For many this is going to but a rehash of previous videos, but this in the 1-hour long version of global population data (2016 Population Reference Bureau).  Clearly he is a proponent of lowering fertility rates–here he paints the optimistic view that population growth growth and development can be balanced in a future that is more ecologically and economically sustainable.  


Tagspopulation, statistics, media, models, demographic transition modeldevelopment.

Why Italy’s ‘Fertility Day’ is backfiring

“Facing a low fertility rate (1.4), Italy is holding its first ‘Fertility Day‘ on Sept. 22, which will emphasize ‘the beauty of motherhood and fatherhood’ and host roundtable discussions on fertility and reproductive health. That may seem inoffensive, but the country’s health department is trying to raise awareness with an ad campaign that’s striking many as misguided and, worse, sexist and alarmist.”

Source: www.cbsnews.com

This pro-natalist campaign designed by the health ministry has received near universal criticism (in an attempt to see other perspectives, I searched for a more positive or even neutral article on the topic and came up empty-handed).  Italy’s Prime Minister openly scoffed at the premise of the campaign, and many pundits argue that it shames and pressures women into thinking about personal choices of childbearing as if they were communal responsibilities.  Unlike the infamous ‘Do it For Denmark‘ advertisements that were filled with playful innuendos, or Singapore’s ‘Maybe Baby‘ which highlights the joys of parenthood, this one has more overtones of duty and plays on fear more than those other pro-natalist campaigns.   


Tags:  ItalyEurope, declining populations, population, demographic transition model, modelsunit 2 population. 


Fertility Rates-Differences Within Countries

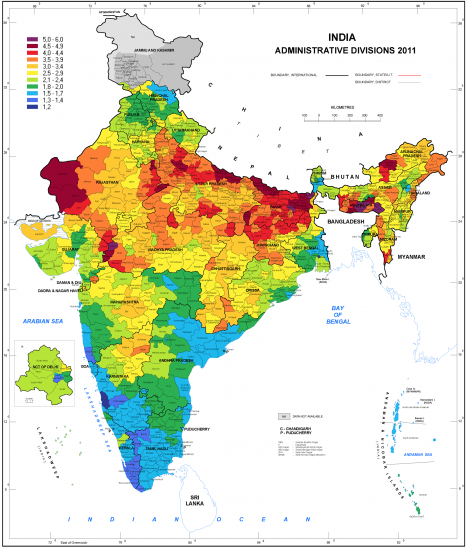
pastedImage3593-467x550

“An important aspect about country level data of fertility to keep in mind is that there can be considerable heterogeneity within countries, which are hidden in the mean fertility which were discussed in this entry. The mean Total Fertility Rate for India in 2010 was 2.8 (UN Data): But this average hides the fact that the fertility in many Southern Indian regions was below 1.5 (which is similar to the mean fertility in many European countries), while the fertility in Northern India was still higher than 5 children per woman (which is as high as the mean of the African countries with the highest fertility).”

Source: ourworldindata.org

This is a stunning example of uneven development and regional differences within countries.  Too often we discuss countries as if the situation inside the borders of one country is the same throughout it, even if the geographic contexts can be wildly different. 

Questions to Ponder: Why are the fertility rates in so different in northern and southern India?  How does this regional imbalance impact the country?  What are other examples of major differences within a country? 

Tags: regions, population, demographic transition model, declining populationmodelsunit 2 population, India, South Asia. 

More young adults are living with their parents

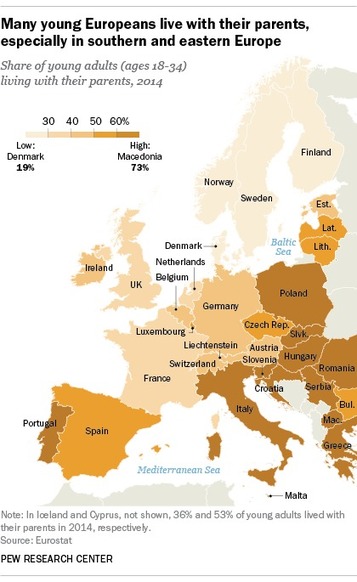
Across much of the developed world, researchers have found that more young adults are living at their parents’ home for longer periods of time.


Across the European Union’s 28 member nations, nearly half (48.1%) of 18- to 34-year-olds were living with their parents in 2014, according to the EU statistical agency Eurostat.  The Scandinavian countries have the lowest rates, with Denmark coming in at 18.6%. Southern and eastern European countries tend to have higher rates, led by the former Yugoslav republic of Macedonia: 72.5% of 18- to 34-year-olds reportedly were living with their parents.

Source: www.pewresearch.org

This isn’t news because this trend gradually became a new part of the economic and cultural norms of the developed world–but the impact is enormous.  In the United States, more young adults live with parents than partners (for the first time in the 130 years that the statistic has been collected).  The world isn’t what it was in 1880.  

32.1% of young adults in the U.S live with parents, and 48.1% of young adults in the European Union Union live with parents.   


Questions to Ponder: What are some contributing factors to this trend in the United States and Europe?  What does this say about housing costs, economic, and cultural conditions? 


Tags: socioeconomic, housingstatisticspopulation, cultural norms, culture.

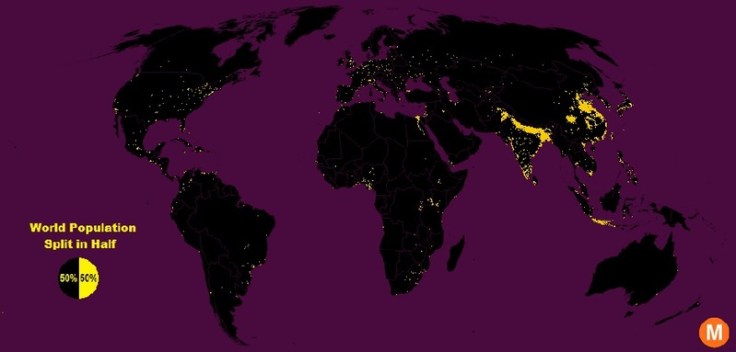
Half the World Lives on 1% of Its Land, Mapped

“Data viz extraordinaire Max Galka created this map using NASA’s gridded population data, which counts the global population within each nine-square-mile patch of Earth, instead of within each each district, state, or country border. Out of the 28 million total cells, the ones with a population over 8,000 are colored in yellow.”


Tags: population, density, mapping, visualization.

Source: www.citylab.com

Create a free website or blog at WordPress.com.

Up ↑