Via Scoop.it – Geography Education
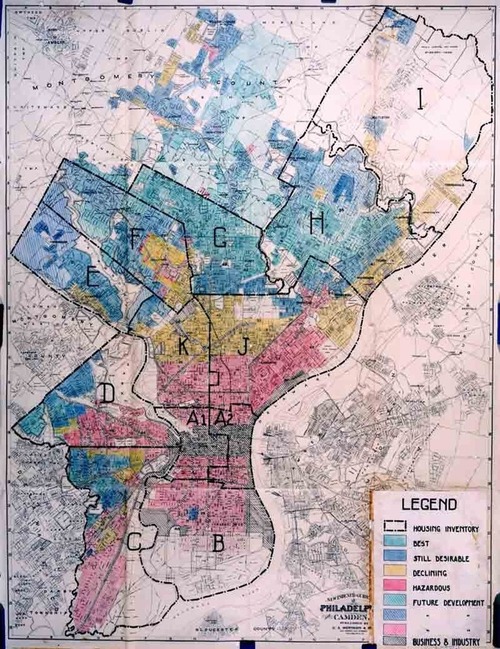
These are great images that shows the can build historical and geographical empathy for those that were discriminated against during the era of redlining. These maps from the Home Owners’ Loan Corporation mapped and shaped regions of urban disinvestment (but the maps were NOT widely circulated). This example of redlining in 1936 Philadelphia, links you to primary source documents if you click on the map. The documents are reports on the property values, resident demographics and descriptions of the residential zones. For more, visit the Philadelphia redlining research project.
Via cml.upenn.edu
- Articles
- APHG Faculty Lectures
- Assessing the Validity of Online Sources
- Brexit: Reaction and the Aftermath
- Comparing Urban Footprints
- Geographic Imagination in the English Anthem ‘Jerusalem’
- Geography on Twitter
- Israeli-Palestinian Conflict updates, 2016
- Learning From Home
- Political and Economic Geography Presentations
- Start-of-the-Year Videos
- Strava Heat Map and National Security
- Teaching about Syrian Refugees
- Thanksgiving Resources
- The Atlas of Economic Complexity: the Case of Costa Rica
- The Geography of E-Waste
- Videos: How Does it Grow?
- California’s Drought
- Cultural Meaning in Moving Monuments
- Gerrymandering
- Navigating and Occupying Gendered Space
- Place and Flash Mobs
- Imaginary Geographies
- Older Articles
- Regional
- Thematic
- Geospatial
- Courses
- Presentations
- About


Leave a comment