See on Scoop.it – Geography Education
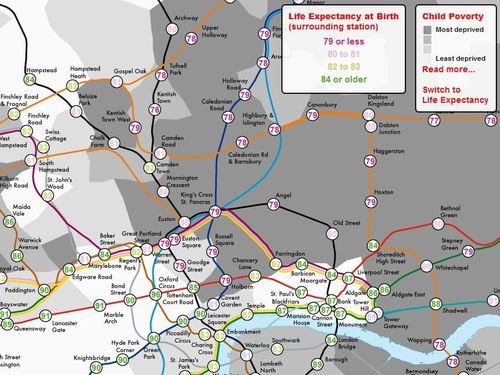
As mentioned by the cartographers of this London map, maps have a way of highlighting the social inequalities especially at the neighborhood scale in the urban environment. Each ward (census tract is colored according to child poverty rates, and the numbers represent life expectany rates in the neighborhood near each underground stop.
See on life.mappinglondon.co.uk


Leave a comment