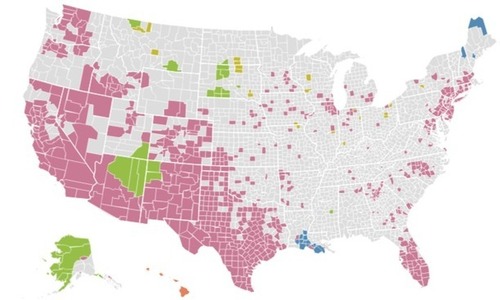
“Counties where at least 10 percent of people speak a language other than English at home.”
Seth Dixon‘s insight:
While this is ostensibly a map that would be great for a cultural geography unit, I’m also thinking about the spatial patterns that created this map. What current or historical migrations account for some of the patterns visible here? What would a map like this look like it it were produced 50 years ago? Why are Vermont and West Virginia the only states without a county with over 10% of the population that speak another language at home?
Tags: language, North America, mapping, regions, census, migration, population, historical, folk cultures, USA.
See on www.washingtonpost.com


Leave a comment