See on Scoop.it – Geography Education
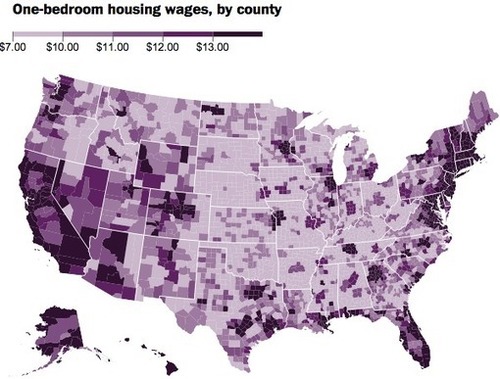
“The National Low Income Housing Coalition took those fair market rents and calculated how much a worker would have to earn per hour to cover such modest housing, if we assume a 40-hour work week and a 52-week year. They call this rate a “housing wage,” and it is, unsurprisingly, much higher than the minimum wage in much of the country.”
This article on the economic geography of housing is supplemented by this interactive map with county-level data. There are a lot of conversations that could stem from an analysis of this data. Where are the housing prices highest? How come? This is a resource that could allow students to explore the economic geography of their own region and apply that local knowledge to understand processes throughout the United States.
Tags: housing, socioeconomic, urban, planning, unit 7 cities.
See on www.washingtonpost.com


Leave a comment