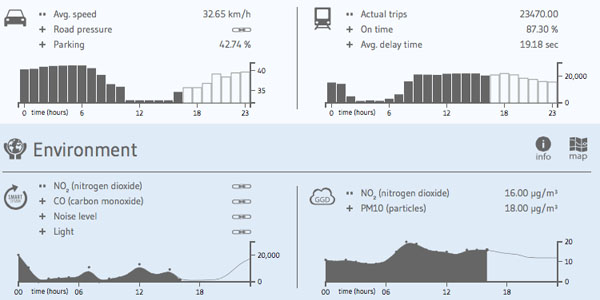
“Amsterdam City Dashboard presents the city of Amsterdam through the lens of data, including demographic statistics, traffic reports, noise readings or political messages.
The small collection of information graphics are divided in distinct domains, such as transport, environment, statistics, economy, social, cultural and security. All data is shown in near real-time, based on blocks of 24 hours. Larger dots and darker colors symbolize higher values, whereas an interactive map provides a geographic reference.”
Tags: Netherlands, urban, statistics, urban ecology, transportation, planning.
Source: infosthetics.com


Leave a comment