“Explore public data through Google’s visualization tools.”
Source: www.google.com
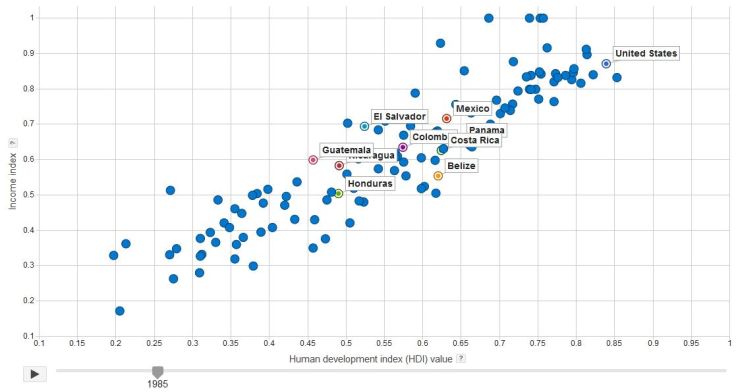
One exercise that I do in many of my classes is based on this data and and outline map. I have the students map out the Human Development Index data for Central America (full global dataset here) on an outline map of the region.
Questions to Ponder: How might we be able to infer about migration within the region? Foreign investment? Political stability?
Tags: Middle America, development, statistics, economic, mapping.


Leave a comment