Global warming has raised global sea level about 8″ since 1880, and the rate of rise is accelerating. Rising seas dramatically increase the odds of damaging floods from storm surges.
Source: sealevel.climatecentral.org
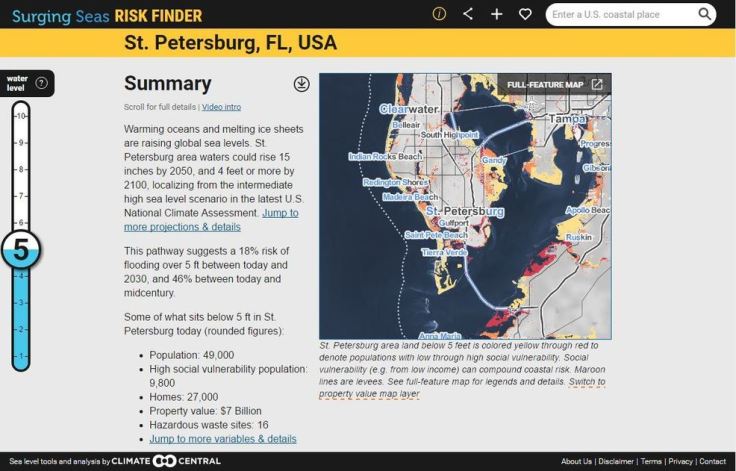
This interactive map from Climate Central dramatically shows what locations are most vulnerable to sea level rise. You can adjust the map to display anywhere from 1 to 10 feet of sea level rise to compare the impact to coastal communities. This dynamic map lets to view other layers to contextualize potential sea level rise by toggling on layers that include, population density, ethnicity, income, property and social vulnerability.
Tags: physical, weather and climate, climate change, environment, resources, water, coastal, mapping, visualization, environment depend, political ecology.


Leave a comment