Search

GEOGRAPHY EDUCATION

Supporting geography educators everywhere with current digital resources.

Month

September 2016

Historic Aerial Mapper

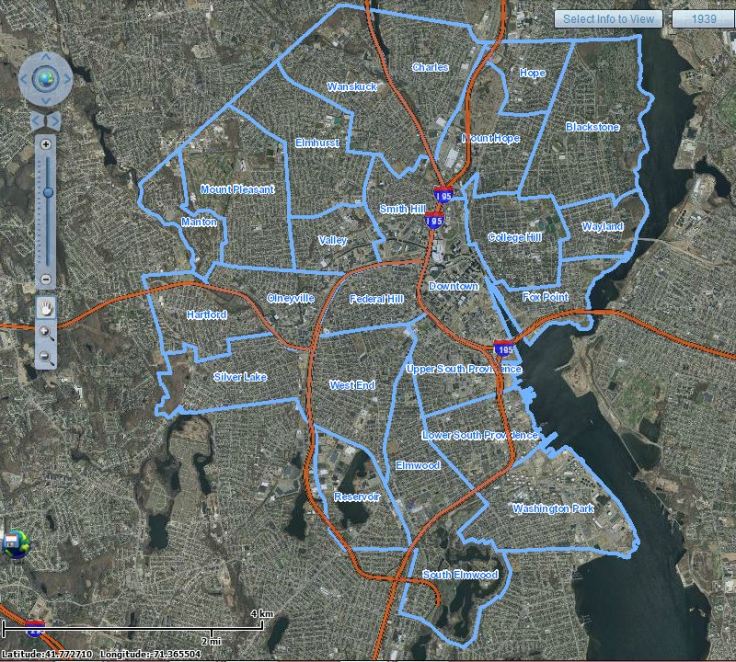
“This application was developed by The Providence Plan utilizing photos from the Rhode Island Geographic Information System.”

Source: mapper.provplan.org

This map is a great archive of historic satellite imagery of the Ocean State, with a special nod to Providence.  This is a great tool that can be used to show how and particular place in Rhode Island has changed over the years at the neighborhood scale.  At the metropolitan scale, it is easy to see the population grown, development expansion, and urban sprawl.  The years of data coverage are 1939, 1952, 1962, 1972, 1981, 1985, 2003, 2008, 2011, and 2014.    


Tags: mapping, Rhode IslandESRIStoryMap, GIS, remote sensing.

Being white, and a minority, in Georgia

“A generation ago, this Atlanta suburb was 95 percent white and rural with one little African-American neighborhood that was known as ‘colored town.’ But after a wave of Hispanic and Asian immigrants who were attracted to Norcross by cheap housing and proximity to a booming job market, white people now make up less than 20 percent of the population in Norcross and surrounding neighborhoods. It’s a shift so rapid that many of the longtime residents feel utterly disconnected from the place where they raised their children.”

Source: www.bostonglobe.com

This article touches on some pretty weighty (and sensitive) topics, but in a fairly nuanced manner.  Local ethnic neighborhoods change as international migration patterns bring in new residents and this demographic shift can is currently impacting national political parties.  That’s geography, various processes at a variety of scales that are all interconnected.  


Tags: migration, ethnicity, neighborhood, scale.  

India watches anxiously as Chinese influence grows

A $46bn economic corridor through disputed territories in Kashmir is causing most concern

Source: www.ft.com

The Indian government doesn’t want to seem threatened by the fact that China is paying for better transportation infrastructure that is essentially in their backyard.  India’s neighbors are excited for the potential economic growth that this can bring, but weary of China’s added clout and power throughout Asia.  As Parag Khanna argues is his new book Connectography, infrastructure and economic linkages will become increasingly more important to geopolitics and global economics; within that lens, China is certainly making a power move here. 


Tags: regions, transportationeconomic.

Cahokia – why did North America’s largest city vanish?

Long before Columbus reached the Americas, Cahokia was the biggest, most cosmopolitan city north of Mexico. Yet by 1350 it had been deserted by its native inhabitants the Mississippians – and no one is sure why

Source: www.theguardian.com

This article is the eighth in the “Lost Cities” series (Babylon, Troy, Pompeii, Angkor, Fordlandia, etc.).  The earthen mounds of Cahokia on the flat flood plains must have been the most awe-inspiring demonstration of political power and economic wealth in its day.  Like so many other civilizations before them (and many more in the future?), Cahokia probably declined from too many environmental modifications that led to unforeseen consequences.


Tagsurban ecology, indigenousenvironment, environment modify, historical, North America.

PBS Election Central

Check out Election Central from PBS with tools, resources & solutions to engage students in the political process.

Source: www.pbseduelectioncentral.com

The first presidential election last night has intensified the already polarized political conversation in the United States. This is a great resource to explore historic political maps and cartograms.  It also has rich tools to project the possibilities for the 2016 election with ready-made lesson plans. 


Tags: electoral, politicalhistorical, mapping.

xkcd: Map Age Guide

Source: xkcd.com

I was riding my bike during Labor Day weekend and chanced upon a yard sale with an old globe going for $4 (of course I bought it and rode home one-handed).  There were some clues that it wasn’t a recent globe (The Soviet Union and Yugoslavia still existed and Burkina Faso was labeled Upper Volta and Zimbabwe was listed as Rhodesia). I knew that if I wanted to know what year this globe was produced, I would need this XKCD guide. XKCD is a comic strip that deals with many intellectual issues, but it can also be a wealth of quality scientific information.  This infographic (hi-res) is amazingly useful if you are trying to find the map of an undated map, but the flow chart also is a wealth of global history and moments that ‘changed the map.’


Tags: XKCD, artinfographic, mapping, trivia, cartography.

The Best News You Don’t Know

I’ve covered massacres in South Sudan, concentration camps in Myanmar and widespread stunting in India, but it’s also important to acknowledge the backdrop of global progress. Otherwise, the public may perceive poverty as hopeless and see no point in carrying on the fight — at just the point when we’re making the most rapid gains ever recorded.

Source: www.nytimes.com

The world is winning the war on extreme poverty, but most Americans think that poverty is getting worse. Doom and gloom can dominate media coverage because a horrific tragedy gets better rating than slow incremental improvements.  The general public is often ignorant of the measurable improvements going on in the world today.  No, the world isn’t perfect, but it is getting better. 


Tags: mediapoverty, development, economic, perspective.

Drones and Geospatial Data

Without sophisticated sensor packages, drones would just be expensive RC airplanes. In this video, Avweb looks at some of the things they can carry.

Source: www.youtube.com

This video gets deep into the specs of sensor packages and the commercial side of UAVs (unmanned aerial vehicles), but it shows how emerging technologies are using and creating geographic data.  This is also a reminder that geography can be incredibly useful in a diverse range of economic sectors and has far-reaching applications in the real world–geography can be incredibly cutting edge.      


Tags: geospatial, video, technology.

The Tidal Waves of the Qiantang River

For hundreds of years, on the eighth month of the lunar calendar, people have gathered along the shores of China’s Qiantang River at the head of Hangzhou Bay to witness the waves of its famous bore tide. Higher-than-normal high tides push into the harbor, funneling into the river, causing a broad wave that can reach up to 30 feet high. If the waves surge over the banks, spectators can be swept up, pushed along walkways or down embankments. Below, I’ve gathered images from the past few years of the Qiantang bore tides.

Source: www.theatlantic.com

This is an amazing set of images, where a cultural phenomenon is wrapped up in observing the pulsating physical geography of the river.  Usually the tidal bore is impressive (but not dangerous–see video here), but occasionally it can be incredibly violent (see this 2015 video).   


Tags: physical, geomorphologywaterChina.

Blog at WordPress.com.

Up ↑