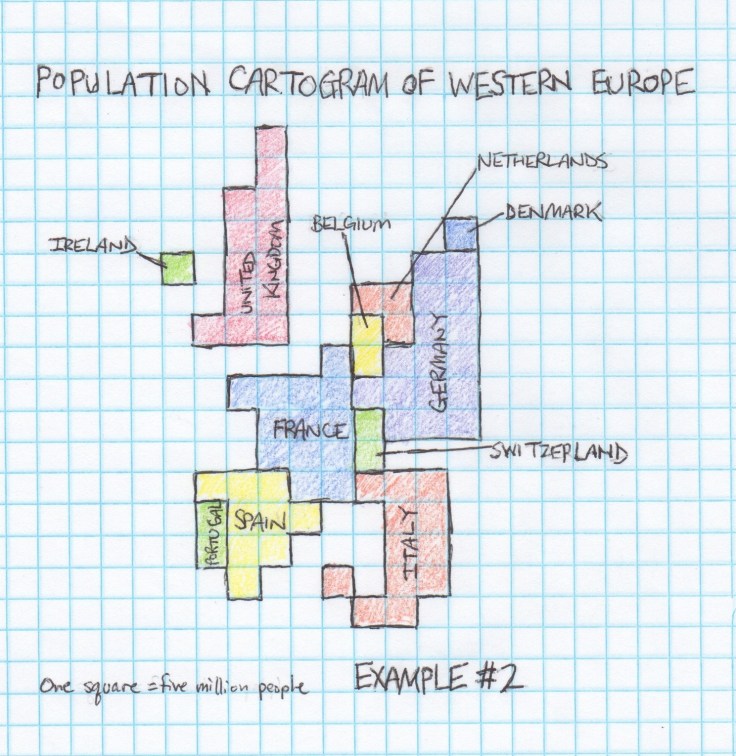
“There are few sights more heartening than that of an elementary school whose classrooms and hallways are decorated with world maps. Yet teachers should be careful to make sure that the standard depiction of the world map is not the only map their students encounter. Otherwise, they run the risk that children will assume ‘this is the way the world looks,’ rather than the more complicated reality that ‘this is one of many ways of representing our world.’ One useful antidote to this way of thinking is for students to explore cartograms, which are maps that use the relative area of places to present statistical data. Please check out my cartogram lesson plan.”
Source: populationeducation.org
I love this post because it shows that–adjusting for mathematical proficiency and cartographic skill–just about any group of students can work on projects to work with data and explore various ways of how to represent that data.
Tags: education, K12, geography education, statistics, spatial, mapping.


Leave a comment