Small towns are as Democratic as big cities. Suburban and rural voters are the Republicans.
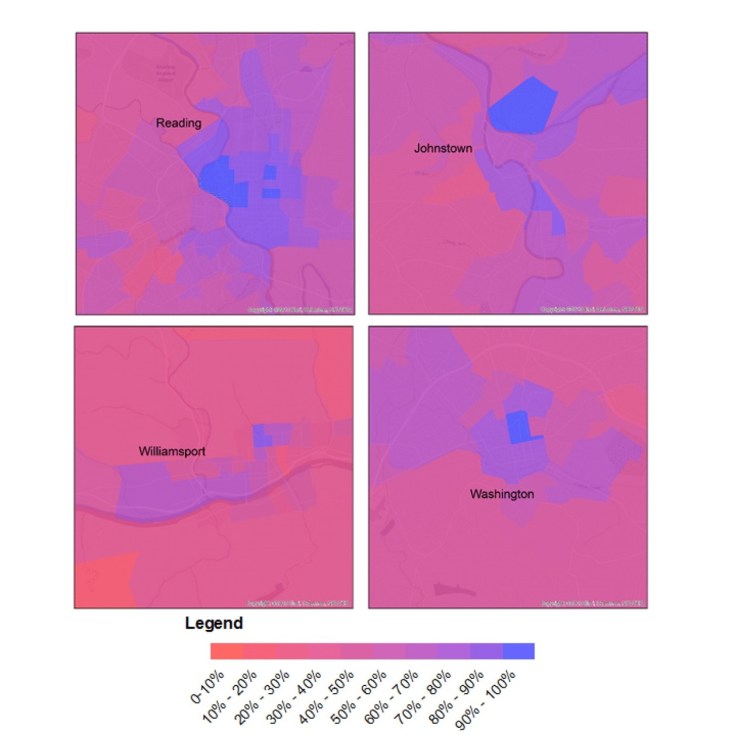
I have assembled a Web map from precinct-level 2008 election data that allows users to zoom in and out, focus in on specific towns or neighborhoods and superimpose census data on income and race, allowing readers to examine their own favorite postindustrial towns. One of the most striking lessons from exploring these maps is that the red non-metropolitan counties on election-night maps are internally heterogeneous, but always following the same spatial pattern: Democrats are clustered in town centers, along Main Street, and near the courthouses schools, and municipal buildings where workers are often unionized. They live along the old railroad tracks from the 19th century and in the apartment buildings and small houses in proximity to the mills and factories where workers were unionized in an earlier era.
Source: www.washingtonpost.com
There have been SOOOO many articles about the 2016 election, what happened, why it happened and how particular demographics voted and why. Most of these articles are highly partisan, or ideologically informed but this just analysis of past spatial voting patterns (I am waiting for the updated version of these maps to show what happened in 2016–but I’m thinking some of this changed). Too often we’ve lumped the geography of small towns and rural areas as though they are one and the same. Too often will only see electoral maps with state-level voting data or possibly county level data; but the sub-county scale reveals what would otherwise be missing in our assessment of electoral, spatial patterns (Scale matters? Who knew?)


Leave a comment