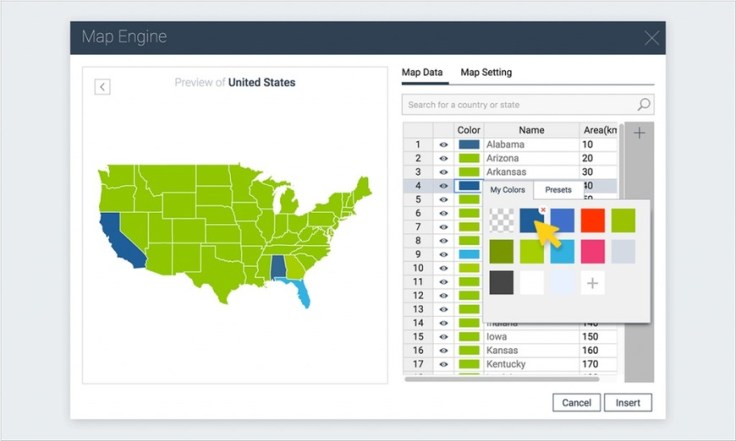
A step-by-step tutorial on how to create an interactive map with Visme, a free online infographic and presentation tool.
Source: blog.visme.co
If you have students use Piktochart to create infographics, then this is a new tool that you should consider. In addition to creating infographics, this allows users to create and embed interactive maps in those infographics. This is a both a baby-step into the world of GIS as well as a way to create student projects that are richly informative.
Tags: APHG, infographic, visualization, mapping, GIS, edtech.


Leave a comment