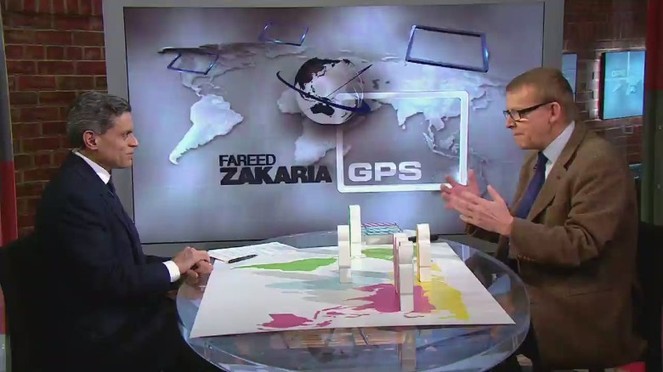
Search

GEOGRAPHY EDUCATION

Supporting geography educators everywhere with current digital resources.

Author

sethdixon

I am a geography professor at Rhode Island College.

Daylight Saving Time Explained

Source: www.youtube.com

If you haven’t discovered CGP Grey yet, his YouTube channel is a veritable fountain of geographic tidbits.  Day Light Savings (whether you agree with it or not) has to do with fundamental Earth-Sun relationships and have some corresponding spatial patterns of who does or does not follow it.  The tag below links to my archive of his many geographically related videos.   


Tags: CGP Grey.

Russia and the Curse of Geography

Want to understand why Putin does what he does? Look at a map.

As things stand, Putin, like Russian leaders before him, likely feels he has no choice but to at least try to control the flatlands to Russia’s west. So it is with landscapes around the world—their physical features imprison political leaders, constraining their choices and room for maneuver. These rules of geography are especially clear in Russia, where power is hard to defend, and where for centuries leaders have compensated by pushing outward.

Source: www.theatlantic.com

Calling this environmental determinism might be a stretch but so is some of the vocabulary (I take it with a grain of salt because the analysis is sound).  This article though certainly puts Russia’s physical geography at the forefront of the geopolitical analysis of Russia’s move’s in both Syria and Ukraine.  Their strategic interests become much more comprehensible in light of their geographic challenges

Tags: UkraineRussia, geopoliticspolitical.

How Modern Cartographers Marry Math and Art

“Old maps get a lot of love, and with good reason—with their sea monsters and sheer craftsmanship, they can transport us through both space and time. But although they lack fold-mark furrows, there’s something to be said for new maps, too. Leafing through Mind the Map, a stunning new book from Gestalten, it’s hard not to think we’re living in the middle of a map renaissance, a time when cartographers and illustrators have good design on their minds and satellite data at their fingertips. This partnership between math and art allows for representations that are not only technically accurate, but also have a sense of a place.”


Tags: mapping, visualization, cartographyunit 1 Geoprinciples.

Source: www.atlasobscura.com

The World’s Driest Desert Is in Breathtaking Bloom

“After historic rains, Atacama, Chile is exploding with vibrant wildflowers.  Here’s a softer side to the disruptive weather phenomenon known as El Nino: an enormous blanket of colorful flowers has carpeted Chile’s Atacama desert, the most arid in the world. The cyclical warming of the central Pacific may be causing droughts and floods in various parts of the world, but in the vast desert of northern Chile it has also caused a vibrant explosion of thousands of species of flowers with an intensity not seen in decades.”

Source: www.smithsonianmag.com

The driest place on Earth, the Atacama Desert in South America, has spectacular vistas and biogeography … especially when it rains.  To read more (and see some stunning images) check out the links from the Washington Post, Yahoo, and the Smithsonian Magazine.   It is amazing that life can flourish in even some of the harshest of physical environments. 


Tags: physical, ChileSouth America, biogeography, environmentecology.

China to end one-child policy

“All couples will now be allowed to have two children, the state-run news agency said, citing a statement from the Communist Party. The controversial policy was introduced nationally in 1979, to reduce the country’s birth rate and slow the population growth rate. However, concerns at China’s aging population led to pressure for change.”

Source: www.bbc.com

The most extensive and controversial anti-natalist program in the world was China’s one-child policy. Experts have been concerned with how fast China is aging and that the population was shrinking faster than would be healthy for the economy. Today that policy was been relegated to the history books, but the impacts of the policy will continue to have far-reaching impacts (for more see the CNN video, Guardian article, and BBC video/article).


TagsChina, populationdeclining populations, unit 2 population, gender.


China’s Maritime Claims

ONE reason China’s spectacular rise sometimes alarms its neighbours is that it is not a status quo power. From its inland, western borders to its eastern and southern seaboard, it claims territory it does not control.

Source: www.youtube.com

Many of the geopolitical conflicts in the East Pacific have their roots in the territorial disputes over islands that at first glance seem as if they wouldn’t be worth the trouble; how did this become a tense situation?  Since the UNCLOS agreement gives countries 200 nautical miles off their coasts to be an Exclusive Economic Zone, that greatly enhanced the strategic value of controlling these islands and the shipping lanes.  The United States, to counter Chinese claims, has used the Navy to go near some of the claimed (and reclaimed) islands recently.  This interactive map briefly highlights some of the details behind the conflicts with links for further readings. 


Questions to Ponder: Why do countries care so much about some minor islands?  Why would other countries not want to accept China’s territorial assertions?


Tags: borders, political, conflict, China, East Asia.

Every Job in America, Mapped

Are you one of the millions of Americans opting into “job sprawl” over a short commute?

Before you dig in to “Where are the Jobs?: Employment in America 2010,” it may help to note that each dot represents a single job—and you can tell what kind of job it is because of its color. Manufacturing and trade jobs are red; professional services jobs are blue; healthcare, education, and government jobs are green; and retail, hospitality, and other service jobs are yellow. You won’t find any dots for federal jobs (no available data), and Massachusetts is missing entirely—the only state to opt out of reporting its employment trends. The end result is a highly detailed map that gives viewers a quick summary of how many and what types of jobs are a part of the economy.


Tags: economic, labor, USA, transportation, industry.

Source: magazine.good.is

Massive landslides caught on camera

A complete collection of the biggest mudslides and rockslides from around the world.

Source: www.youtube.com

This is a terrifying and mesmerizing compliation that shows the raw power of the Earth.  

Tags: physical, geomorphology, erosion, landforms.

The Atlas of Economic Complexity

“The Atlas is a powerful interactive tool enabling policy makers, entrepreneurs, academics, students and the general public to map the path of diversification and prosperity for 128 countries.  The tool will allow users to explore growth opportunities by country and industry, with the potential to provide input into economic policy and private investment decisions. The analysis may also be used to inform the agendas of development banks in policy recommendations and loan programming; an entrepreneur developing a market plan; an investment promotion agency pitching a new factory, as well as guide other choices we have yet to imagine.” http://wp.me/P2dv5Z-21a

Source: www.youtube.com

This video is an introduction to the Atlas of Economic Complexity; in it they use the visualization tool to analyze the Netherlands’ economy and the cut flower industry.  The Atlas of Economic Complexity is hosted by the Center for International Development at Harvard University (MIT also worked on this project and on their site it is called the Observatory of Economic Complexity).


Tags: developmentindustry, visualization, statistics, economicNetherlandsvideo.

Blog at WordPress.com.

Up ↑