Search

GEOGRAPHY EDUCATION

Supporting geography educators everywhere with current digital resources.

Author

sethdixon

I am a geography professor at Rhode Island College.

For the Muslims of CAR, it’s ‘leave or die’

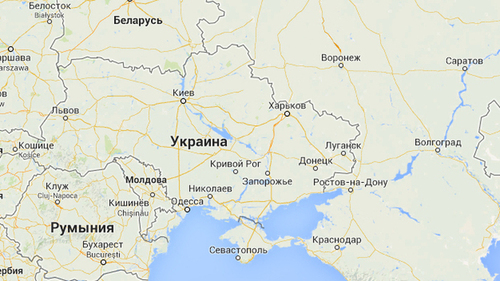
Thousands of Muslims in the Central African Republic have fled as UN chief warns of ‘ethno-religious cleansing’.


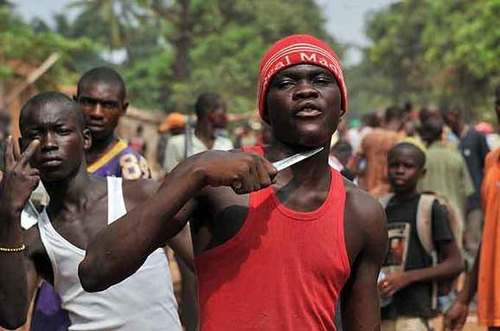
Leave or die.  It’s come down to this for the Muslims of Bangui, the capital of the Central African Republic.  Muslims here once lived freely among the Christian majority, running businesses and praying in mosques. Now, many of the city’s Muslims have fled, and on Sunday about 1,300 Muslims from Bangui’s PK12 neighbourhood were evacuated to safety by peacekeeping forces.

Already one of the world’s poorest countries, CAR has seen a wave of upheaval and violence in the past 15 months. The 10-month reign of the Muslim-dominated Seleka rebel group inflamed intercommunal tensions in the country, and spurred the rise of Christian militias called the anti-Balaka.  Once the Seleka was forced out of power in January, the anti-Balaka rampaged, targeting Muslims across the country for their perceived support of the Seleka and its bloody excesses.

See on www.aljazeera.com

Google Maps Displays Crimean Border Differently In Russia, U.S.

See on Scoop.itGeography Education

“America and its allies have refused to accept the region’s separatist move to join Russia.  A look at the maps available on two Google Maps Web addresses — one ending in .com and another in .ru — shows the disparity. In Russia, Web visitors see a solid line dividing Crimea from neighboring Ukraine. In the U.S., a dotted line separates the two, implying a disputed status within the country.”

Seth Dixon‘s insight:

This isn’t the only international border dispute that is displayed differently in Google Maps.  Google uses over 30 distinct versions of international borders.  This brings up more questions than it answers–How is the Kashmir displayed in India?  Pakistan?  The West Bank in Israel or Egypt?  If you haven’t explored Google Maps in other languages, consider this your invitation to read maps as you would a text and to think about the political implications of making a map.   

Tags: google, mapping, borders, political.

See on www.wbur.org

The Deadliest Animal in the World

See on Scoop.itGeography Education

Bill Gates introduces Mosquito Week on his personal blog, the Gates Notes. Everything posted this week is dedicated to this deadly creature. Mosquitoes carry devastating diseases like malaria, dengue fever, yellow fever, and encephalitis.

Seth Dixon‘s insight:

We might be more terrified of large-bodied predators, but mosquitoes are the main vector of some deadly diseases.  Mosquitoes kill more people in 4 minutes that sharks do in an entire year.  The distribution of mosquitoes is a critical component in the geography of development.  This isn’t just a nuisance; it’s a matter of life or death.  

Tags: medical, development.

See on www.gatesnotes.com

News Literacy: Critical-Thinking Skills for the 21st Century

See on Scoop.itGeography Education

“Every teacher I’ve worked with over the last five years recalls two kinds of digital experiences with students.The first I think of as digital native moments, when a student uses a piece of technology with almost eerie intuitiveness. The second I call digital naiveté moments, when a student trusts a source of information that is obviously unreliable. How can these coexist? How can students be so technologically savvy while also displaying their lack of basic skills for navigating the digital world?”

Seth Dixon‘s insight:

This is a nice article with some practical advice but it also can that helps us conceptualize the thinking skills that our students are going to need in the future(with a classic photo that embodies 20th century news literacy).  Previously, I’ve written on this same topic, with some strategies to how to help students assess the validity of online information with geographic content (with a series of maps and images).  I know I’ve been duped before, and it’s okay to admit that to your students; but we need to teach students how to be critical readers as they are swimming in an ocean of digital information of variable quality.  This is why I see content curation as an important part of modern education; it is a way to teach student the tools to assess the quality of information for themselves.  They will be gathering, organizing and synthesizing digital information for rest of their lives.        

See on www.edutopia.org

Here are three of Russia’s military options in Ukraine, complete with maps

See on Scoop.itGeography Education

There have been a number of warnings from Kiev and Washington about the possibility of a direct and open Russian military intervention in Ukraine. But what could that look like?

Seth Dixon‘s insight:

I’m not saying any of these 3 scenarios are going to happen nor am I endorsing them either.  That said, this article/podcast provides a geopolitical analysis (with maps) of Russia’s potential military options if they are planning on invading Ukraine. 

See on www.pri.org

What you’d need to make in every county in America to afford a decent one-bedroom

See on Scoop.itGeography Education

“The National Low Income Housing Coalition took those fair market rents and calculated how much a worker would have to earn per hour to cover such modest housing, if we assume a 40-hour work week and a 52-week year. They call this rate a “housing wage,” and it is, unsurprisingly, much higher than the minimum wage in much of the country.”

Seth Dixon‘s insight:

This article on the economic geography of housing is supplemented by this interactive map with county-level data. There are a lot of conversations that could stem from an analysis of this data.  Where are the housing prices highest?  How come?  This is a resource that could allow students to explore the economic geography of their own region and apply that local knowledge to understand processes throughout the United States.   

Tags:  housingsocioeconomic, urban, planning, unit 7 cities.

See on www.washingtonpost.com

Secretary Kerry Delivers Remarks on Ukraine


“U.S. Secretary of State John Kerry deliver remarks on Ukraine at the U.S. Department of State in Washington, DC on April 24, 2014. A transcript is available here.”

Seth Dixon‘s insight:

If you want to understand the U.S. government’s official stance and perspective on the escalating geopolitical tensions between Ukraine and Russia, this speech is a good place to start.  The U.S. government doesn’t want to forget that Crimea is already occupied by Russia and the short video below expands the U.S. perspective on the reasons behind the crisis.

Tag: Ukraine, political, conflict.

Nine Cities That Love Their Trees

See on Scoop.itGeography Education

More and more American cities are working to preserve their trees. Here’s a look at nine cities working to conserve their tree canopies.

Seth Dixon‘s insight:

Happy Arbor Day!  Trees and vegetation play a vital role in the urban ecology of a city and many planners actively work towards creating more green infrastructure.  This National Geographic feature highlights nine cities that promote green spaces.  As I’ve mentioned before, trees are also a part of social inequities that can be seen in our urban landscapes.  The more trees there are in a neighborhood, the greater the socioeconomic standings of that community in a metropolitan area, and conversely, poverty-stricken areas usually have minimal canopy cover (thought exercise–what does this correlation mean?). 

Tagsurban ecology, biogeography, environmentecology, urban, socioeconomic, neighborhood.

See on www.nationalgeographic.com

A Map of Baseball Nation

See on Scoop.itGeography Education

“Fans may not list which team they favor on the census, but millions of them do make their preferences public on Facebook. Using aggregated data provided by the company, we were able to create an unprecedented look at the geography of baseball fandom, going down not only to the county level, as Facebook did in a nationwide map it released a few weeks ago, but also to ZIP codes.”

Seth Dixon‘s insight:

This isn’t just a fun sports map–there are some good geographic concepts that can be used here.  When discussing cultural regions, many use the core-domain-sphere model.  This map uses the brightest color intensities to represent the core regions and the lightest hues to show waning strength, but to still signify that the area is a part of a team’s sphere of influence.  Essentially, this map is begging you to explore the borderlands, the liminal “in-between” spaces that aren’t as easy to explain.  What other phenomena can be used to demonstrate the core-domain-sphere model of cultural regions?  What other geographic concepts can you teach using this map?  

Tags: fun, sport, placeborders, statistics, mapping, regions.

See on www.nytimes.com

Blog at WordPress.com.

Up ↑