Search

GEOGRAPHY EDUCATION

Supporting geography educators everywhere with current digital resources.

Author

sethdixon

I am a geography professor at Rhode Island College.

Iqaluit’s population turns to Amazon Prime

Sky-high food prices in the North have led many residents of Iqaluit to turn to Amazon Prime to save on necessities. But is that a sustainable solution?

Source: globalnews.ca

Nunavut is remote…far more remote than most of our students can imagine.  They live over 1,000 miles from any city with half a million people.  The entire territory is enormous, but sparsely populated with only 36,000 people.  Try to image getting commercial goods to such a remote location.  The Canadian government has invested heavily to subsidize systems to get food products and other necessities to Nunavut.  Still, the transportation costs are so high, and the numbers are so few that economies of scale can’t help this situation. 

Enter Amazon Prime in 2005, and the online retail giant began offering free shipping for “Prime” customers for a flat yearly subscription fee (today $99 in the U.S.).  This was simply too good to be true for many customers in far-flung settlements in Nunavut.  Amazon, probably not anticipating the overwhelming transportation costs associated with a place like Nunavut, in 2015 stopped offering Prime membership for Nunavut customers that do not live in the capital city of Iqaluit.  Still, the capital city looks to Amazon Prime more so than the Canadian or territorial government as their lifeline to the global economy.  Some even argue that Amazon Prime has done more to improve the standard of living  and providing food security for Nunavut residents than the government.            

Scoop.it TagsCanada, distanceindigenous, poverty, development, economicfood, food distribution, density.

WordPress TAGS: Canada, distance, indigenous, poverty, development, economic, food distribution, density.

Using BatchGeo

"Quick tutorial on using BatchGeo to create a map using your own spreadsheet (Excel) data."

Source: www.youtube.com

BatchGeo is incredibly easy to use mapping platform…think of it as GIS-lite, but only for simple points on a map (no lines or polygons). If you have a spreadsheet full of point data, you can make a map with your own data. You can grab data straight from an online list (like Wikipedia), but you can also use spreadsheets, databases, or any other tab delimited dataset.

Scoop.it Tagsmapping, CSV, edtech.

WordPress TAGS: mapping, edtech.

The Enlightenment Is Working

"Don’t listen to the gloom-sayers. The world has improved by every measure of human flourishing over the past two centuries, and the progress continues, writes Steven Pinker."

Source: www.wsj.com

This is a great article that only reiterates what was said in Hans Rosling’s Book, FACTFULNESS, that the world is getting better. 

Scoop.it Tagsstatistics, development, perspective.

WordPress Tags: statistics, development, perspective.

OPEC’s Worst Nightmare: Permian Is About to Pump a Lot More

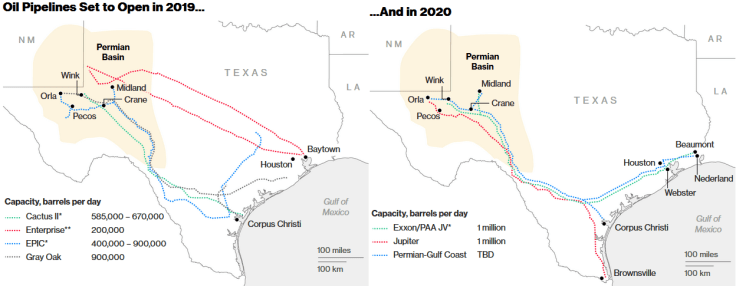
"An infestation of dots, thousands of them, represent oil wells in the Permian basin of West Texas and a slice of New Mexico. In less than a decade, U.S. companies have drilled 114,000. Many of them would turn a profit even with crude prices as low as $30 a barrel. OPEC’s bad dream only deepens next year, when Permian producers expect to iron out distribution snags that will add three pipelines and as much as 2 million barrels of oil a day."

Source: www.bloomberg.com

Overall global commodity prices are impacted by countless local production costs. A large shift in how business is done in one place (in this example, Texas’ Permian Basin) can have reverberating impacts on the local productions of other places that focus on that same global commodity (OPEC).  

GeoEd Tags: energy, resources, economic, political ecology.

Scoop.it Tagsenergy, resources, economic, political ecology.

Leading the Location Intelligence Revolution

"As GPS devises, sensors, and drones proliferate, the power of location intelligence increases exponentially. This means LI can bring clarity to the most pressing business challenges – even those that at first glance don’t seem location related. Esri has location down to a science – The Science of Where. Examples from the Bavarian Police Department, Switzerland’s largest retailer, Migros, the Port of Rotterdam, and the European Environment Agency, provide just a taste of the broad scope of challenges that can be tackled through the lens of where."

Source: www.youtube.com

This video is a good demonstration of the value of GIS, geospatial technologies, and locational intelligence. 

GeoEd Tags: GIS, esri, video, mapping, cartography, geospatial, technology.

Scoop.it Tags: GIS, ESRIvideo, mapping, cartography, geospatial, technology.

Here’s What Your Part Of America Eats On Thanksgiving

"Every region enjoys pumpkin pie. But beyond that, there are three Americas: The America that disproportionately has apple pie (New England and the Middle Atlantic), the America that has pecan pie and sweet potato pie (the assorted South), and the America that consumes cherry pie (the Midwest and West)."

Source: fivethirtyeight.com

In addition to this list of distinctive Thanksgiving recipes from each state (I’d love to try so many on this list), the NY Times has also produced this list of the most ‘Googled’ Thanksgiving recipes in each state.  This StoryMap from ESRI is my favorite map of food production, showing where the food on the thanksgiving dinner plate actually came from.  These are very late additions to my favorite Thanksgiving day resources. Happy Thanksgiving everyone, and may yours reflect some some regional distinctiveness and cultural context that you appreciate.   

GeoEd Tags: food, food distribution, food production, agriculture.

Scoop.it Tags: foodfood production, agriculture.

How to make cities more walkable

"Investing in walkable cities, whether through allocating funds to repaint pedestrian walkways or building affordable housing close to downtowns, also attracts diverse populations and creates jobs. According to the Chicago Metropolitan Agency for Planning, 63 percent of millennials and 42 percent of boomers would like to live in a place where they don’t need a car. And according to the National Association of Realtors, 62 percent of millennials prefer to live in a walkable community where a car is optional. If cities seem less automobile-dependent, chances are they are more appealing to a range of ages."

Source: www.vox.com

Walkable cities improve the local economy and many cities are working to improve their walkability.  Cities can improve sidewalks, decrease parking lots, beautify storefronts and add other amenities that encourage walking. Neighborhoods that are very walkable often have a vibrant sense of place.  This article (and the embedded video) nicely explain many issues surrounding walkable urban environments.   


GeoEd Tags: urban, place, neighborhood, transportation, planning, urbanism, architecture.

Scoop.it Tags: urban, place, neighborhoodtransportationplanning, urbanism, architecture.

Crop Intensity Visualized

This visualization shows Crop Intensity data (regions that produce the most crops), followed by the MODIS croplands product, the 26 countries that produce 82% of the world’s food, the population density in 2002 and finally the projected population in 2050.

Source: svs.gsfc.nasa.gov

Follow the link to a video/animation that displays several important global agricultural trends.  NASA’s Scientific Visualization Studio has produced many other agricultural visualizations that would be useful for teaching about the patterns of global agriculture. 

Tags: food production, agribusinessvisualization, agriculture.

WordPress TAGS: food production, agribusiness, visualization, agriculture.

Inside Hong Kong’s cage homes

Hong Kong is the most expensive housing market in the world. It has been ranked as the least affordable housing market on Earth for eight years in a row, and the price per square foot seems to be only going up. The inflated prices are forcing Hongkongers to squeeze into unconventionally small spaces that can affect their quality of life.

Source: www.youtube.com

Land scarcity is usually the main culprit behind extremely high real estate markets in the world’s most expensive housing markets.  Silicon Valley, New York City, and other urban areas that are magnets for a young, well-educated workforce have very high costs of living.  The rising property values and rents make living in a city on the rise difficult for many of the residents that aren’t a part of the economic rising tide (gentrification is just particular example).   

Hong Kong is a very peculiar example were land scarcity is only a part of the situation.  Bad land use (3.7% zoned for high density housing) policy and land management are bigger culprits.  The government essentially owns all the land in Hong Kong and leases it to developers, so developers are incentivized to drive up that rates, given that the government doesn’t want to tax the corporations for the land that they occupy.

Season 2 of Vox borders has 5 episodes about Hong Kong:

  1. How British rule shaped Hong Kong
  2. China is erasing its border with Hong Kong
  3. Feng shui shaped Hong Kong’s skyline
  4. Decline of Hong Kong’s neon glow
  5. Hong Kong’s cage homes (profiled above)

WordPress TAGS: housing, urban, spatial, density, planning, urbanism, China.

Create a free website or blog at WordPress.com.

Up ↑