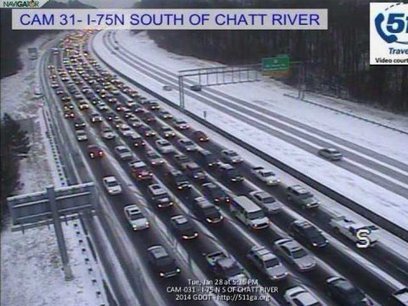
“Republicans want to blame government (a Democrat thing) or Atlanta (definitely a Democrat thing). Democrats want to blame the region’s dependence on cars (a Republican thing), the state government (Republicans), and many of the transplants from more liberal, urban places feel the same way you might about white, rural, southern drivers. All of this is true to some extent but none of it is helpful.”
Seth Dixon‘s insight:
There are no easy answers, but that doesn’t mean we people aren’t trying to frame this in an easy narrative.
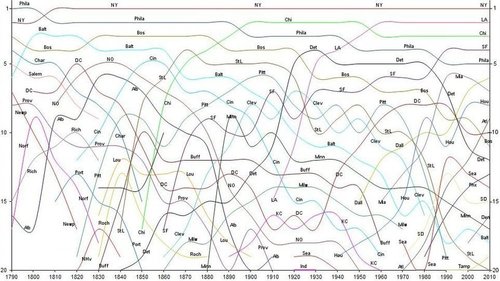
“The graph and tables on this page attempt to show how the urban hierarchy of the United States has developed over time. The statistic used here is the population of the metropolitan area (contiguous urbanized area surrounding a central city), not the population of an individual city. Metropolitan area population is much more useful than city population as an indicator of the size and importance of a city, since the official boundaries of a city are usually arbitrary and often do not include vast suburban areas. For example, in 2000 San Antonio was the 10th largest city in the U.S., larger than Boston or San Francisco, but its Metro Area was only ranked about 30th. The same thing was happening even back in 1790: New York was the biggest single city, but Philadelphia plus its suburbs of Northern Liberties and Southwark made it the biggest metro area.”
“Think of coffee and you will probably think of Brazil, Colombia, or maybe Ethiopia. But the world’s second largest exporter today is Vietnam. How did its market share jump from 0.1% to 20% in just 30 years, and how has this rapid change affected the country?”
Seth Dixon‘s insight:
Vietnam is a historically tea-drinking country, and when the French colonized, they brought coffee. Culturally they still prefer tea, but in the 1980s, the government say this as a major export crop that they were climatically primed to produce. This rapid growth has bolstered the economy, but has had some adverse environmental impacts as well. The article is rich in geographic topics to bring into the classroom.
“On Tuesday, President Obama, if precedent holds, will declare that the state of America’s union is ‘strong.’ Is it?”
Politico Magazine rounded up 14 different state rankings from reputable sources like the Census Bureau, the Centers for Disease Control and Prevention, and the FBI, and on important factors such as high school graduation rates, per capita income, life expectancy and crime rate. Then we averaged out each state’s 14 rankings to come up with a master list—atop which sits none other than New Hampshire. The approach isn’t scientific or comprehensive (we also hold no grudges against the State of Mississippi), but given that eight of the lowest-ranking states on our list overlap with the bottom 10 on his, maybe less has changed in the past 83 years than you’d think.
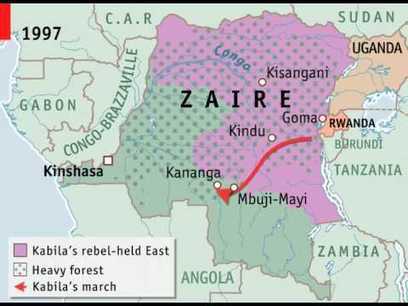
Mapping the war in Congo: mineral wealth, militias and an epic march
Seth Dixon‘s insight:
To understand much of the political situation in Central Africa, a short history of the recent political and ethnic turmoil in Rwanda and Congo are helpful. This particular videographic from the Economist is a few years old, but the historical context is still incredibly relevant This series provides a wealth of information and several will be added to the place-based geography videos interactive map.
Twenty kilometers (12 miles) from England’s Kent and Essex coasts, the world’s largest offshore wind farm has started harvesting the breezes over the sea. Located in the Thames Estuary, where the River Thames meets the North Sea, the London Array has a maximum generating power of 630 megawatts (MW), enough to supply as many as 500,000 homes.
The wind farm became fully operational on April 8, 2013. Twenty days later, the Operational Land Imager (OLI) on the Landsat 8 satellite captured this image of the area. The second image is a closeup of the area marked by the white box in the top image. White points in the second image are the wind turbines; a few boat wakes are also visible. The sea is discolored by light tan sediment—spring runoff washed out by the Thames.
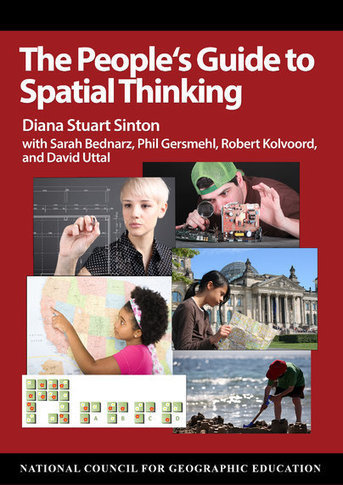
“One of our colleagues and leaders in spatial thinking in education, Dr. Diana Stuart Sinton, has written a book entitled The People’s Guide to Spatial Thinking, along with colleagues Sarah Bednarz, Phil Gersmehl, Robert Kolvoord, and David Uttal. As the name implies, the book provides an accessible and readable way for students, educators, and even the general public to understand what spatial thinking is and why it matters. It “help[s] us think across the geographies of our life spaces, physical and social spaces, and intellectual space.” Dr. Sinton pulls selections from the NRC’s Learning to Think Spatiallyreport and ties them to everyday life. In so doing, she also provides ways for us in the educational community to think about teaching these concepts and skills in a variety of courses. Indeed, as she points out, spatial thinking is particularly essential within science, technology, engineering, and mathematics, as well as geography.” – See more at: ESRI’s GIS Education Community blog.
For Regional Geography, I ask that all my students take online quizzes before coming to class because it is very difficult to intelligently discuss European issues if you don’t know the countries of Europe, where they are and what other countries are on their borders. Quizzes and knowing places doesn’t define geography, but if geography were English literature, knowing about places could be described as the alphabet–before you write a sonnet or critique an essay, you better know your ABC’s and basic grammar. Given that, I like the Lizard Point Geography quizzes, Sheppard Software quizzes and those from Click that ‘Hood; they are simple, straightforward and comprehensive. Below is a YouTube video that shows how to take the Lizard Point quizzes.
You can take them in practice, test or strict test mode. Once you are fully prepared, take the test in “strict test mode.” When you get the score you are content with, click on “View Detailed Results.” Enter your name to produce an image like the one below:
Throughout the semester, you will need to collect these images as screenshots (use the snipping tool or print screen function) to turn in as proof that you took the quizzes. You can also grab a screenshot of your results on Click that ‘Hood (without your name, but with a time).
During the course of the semester in World Regional Geography, you should complete all of the following quizzes (and 9 more for a total of 20 quizzes):