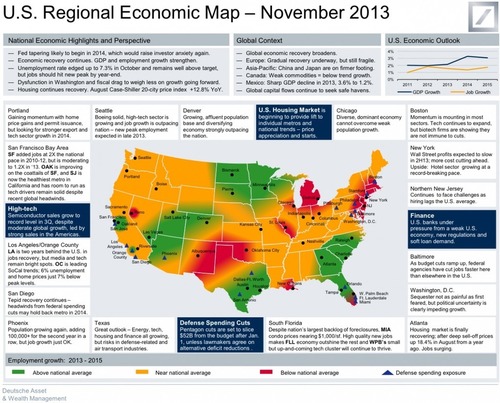
From Deutsche Asset & Wealth Management.
See on www.businessinsider.com


Boston-born Jennifer Grout has amazed Middle Eastern viewers, reaching the Arabs Got Talent final despite speaking little Arabic
Born and raised in Boston, Grout’s Arabic accent has inspired debates about whether she is merely pretending to be a westerner. Her fellow contestants are from different parts of the Middle East, and include Mayam Mahmoud, 18, billed as Egypt’s first hijab-wearing rapper.
TV shows have regionalized networks, but sometimes the audience wants something beyond their local borders and that pushes the limits of what many think that audience might want or even redefine the audience itself. Hijab-wearing rappers and blond-haired, blue-eyed girls from Boston singing in Arabic certainly blur the distinction between what we think is Middle Eastern and what think of as American. Globalization is increasing erasing those cultural lines.
See on www.theguardian.com
Don’t Panic – is a one-hour long documentary broadcasted on BBC on the 7th of November 2013.
The visualizations are based on original graphics and stories by Gapminder and the underlaying data-sources are listed here.
Hans’s — “All time favorite graph”, is an animating bubble chart linking health and wealth which you can interact with online here and download offline here.
Population growth in an important topic that is connected to economic development. If you’ve seen Hans Roslings TED talks, this is an hour-long version of many of the same concepts and data visualizations. His Gapminder data visualization tool, it is a must see for geography teachers to show the connections between population statistics and developmental patterns–let students see the data.
This is an article that looks at a different factor, arguing that overpopulation isn’t the real issue.
Tags: gapminder, population, demographic transition model, development.
See on www.gapminder.org
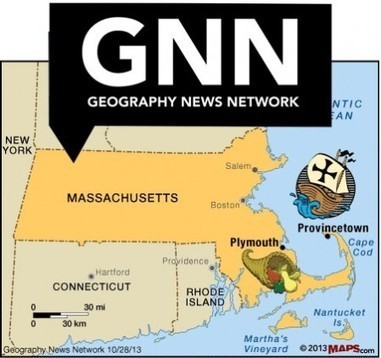
“Thanksgiving has some fascinating spatial components to it. My wife and I prepared an article for the Geography News Network that was converted to a podcast; this podcasts shows the historical and geographic context of the first Thanksgiving and in the memorialization of Thanksgiving as a national holiday (if you don’t subscribe to Maps 101, it is also freely available as a podcast on Stitcher Radio or iTunes).”
One of my favorite combinations of maps for Thanksgiving involves the geography of food production and food consumption. When we start looking at the regional dishes on Thanksgiving plates we can see some great patterns. This ESRI storymap asks the simple question, where did your Thanksgiving Dinner come From?
This StoryMap is a great resource to combine with this New York Times article that shows the regional preferences for the most popular Thanksgiving recipes. Where are sweet potatoes grown? Where do people make sweet potato pie for Thanksgiving?
Plymouth County, MA is heart of only 3 cranberry producing regions and is was also home to the first Thanksgiving. How has this New England local ecology and traditional food patterns influenced national traditions?
For these and more Thanksgiving resources on scoop.it, click here.
See on maps101blog.com
“A comprehensive listing of world capital cities that have moved from one city to another.”
What happens when a country moves it’s capital city? Why would a country choose to move it’s capital? This list (with some short historic and geographic context) helps answer those questions.
See on geography.about.com
“The AidData Center for Development Policy creates geospatial data and tools enabling development stakeholders to more effectively target, coordinate and evaluate aid. Funded through a five-year, $25 million cooperative agreement with USAID, the Center is a partnership between the College of William and Mary, Development Gateway, Brigham Young University, the University of Texas at Austin, and Esri.”
This article in the Washington Post asks if foreign aid can make elections more competitive (spoiler alert: mapping the data at the sub-national level helps answer research questions like this). What intrigued me even more than the article was the mapping platform that it was introducing. AidData is a fabulous new mapping platform to access information about international aid, it’s effectiveness and where it is needed and what current projects are being funded by U.S. AID.
See on aiddata.org
A Danish graphic designer has pieced together historic photos and maps to create an interactive digital diorama of the fateful moments
The Maps 101 podcast that I wrote was more on the life of JFK, this Smithsonian Blog article is more about his death. Which is more interesting? It all depends on your perspective as there was plenty of mystery and drama in both life and death for JFK.
See on blogs.smithsonianmag.com
“This visualization shows global winds from a GEOS-5 simulation using 10-kilometer resolution. Surface winds (0 to 40 meters/second) are shown in white and trace features including Atlantic and Pacific cyclones. Upper-level winds (250 hectopascals) are colored by speed (0 to 175 meters/second), with red indicating faster.”
This global map of wind speeds is a great companion to this United States map. This interactive map is a ‘nearly live’ dynamic display of United States winds patterns (speed, direction and broad spatial context).
See on www.nasa.gov