Search

GEOGRAPHY EDUCATION

Supporting geography educators everywhere with current digital resources.

Category

Uncategorized

A 250-mile show of support for Catalonia independence

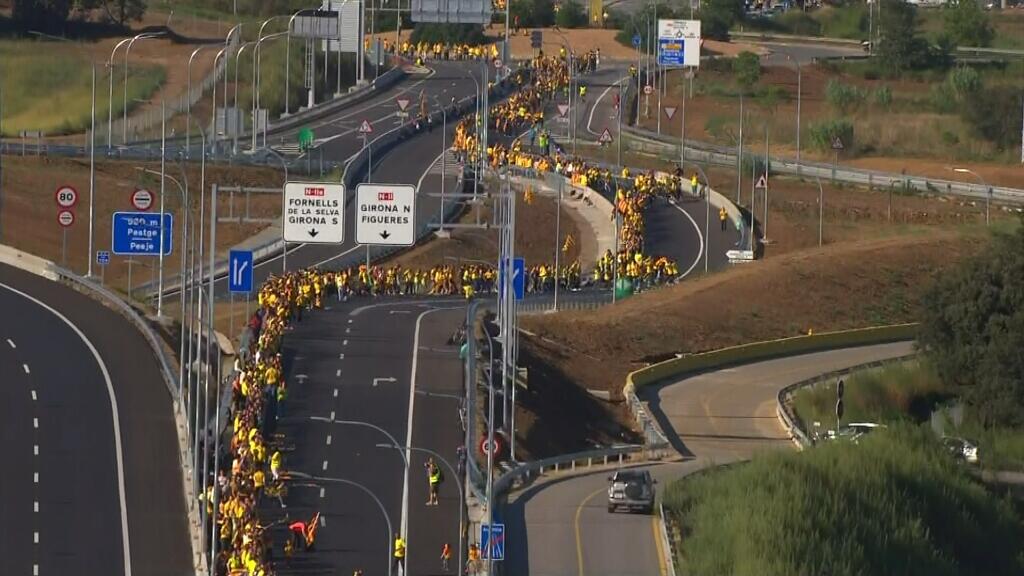
More than 1 million flag-draped and face-painted Catalans held hands and formed a 250-mile human chain across the northeastern Spanish region Wednesday in a demonstration of their desires for independence.

Seth Dixon‘s insight:

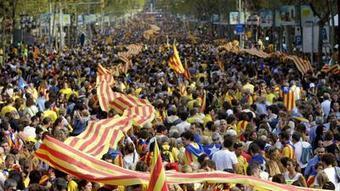
September 11th means different things is different places.  While many Americans were remembering the terrorist attacks of 2001, it was Catalonian National Day.  In addition to the festivities, they organized a massive public demonstration to support independence and to garner international attention.  They created a ‘human border’ that stretched across the region to apply pressure on the Spanish government to allow a vote that would let Catalonia break away and form their own country.  While this energy and enthusiasm swept Barcelona, the Spanish government stopped the protest from spreading into neighboring Valencia (many Valencians speak Catalan).

Questions to Ponder: How do public events such as this impact the political process?  Is it significant that the link about the Spanish government stopping Valencia comes from a Scottish newspaper?  Why?  How can social media and technology (such as the hastags #CatalanWay #ViaCatalana) impact social movements?  

Tags: Catalonia, Spain, political, devolution, autonomyEurope, culture.

See on www.latimes.com

Human Border

Above Australia’s Northern Territory

Over half of Australia lies within the tropics, but it is home to only five percent of the population. It is a frontier land with little infrastructure, populated by cattle barons, crocodile hunters and aboriginal tribes.

Seth Dixon‘s insight:

Australia’s Northern Territory(NT) is region that is climatically inhospitable to large human settlements and is the least population region of the lightly population country.   Uluru (Ayer’s Rock) is the Northern Territory’s iconic landscape, and it is home to approximately 212,000 people according to the 2011 Australian census.  Most of the economic activity centers on resources extraction (mining); aboriginal groups control 1/5th of the NT which many hope to discourage.  This photo gallery provides a excellent glimpse into these remote places.

TagsAustralia.

See on www.boston.com

Interactive: Mapping the Shale Gas Boom

Where in the United States is fracking unlocking natural gas from shale rock?

Seth Dixon‘s insight:

See on www.smithsonianmag.com

3D relationships on 2D surfaces

Seth Dixon‘s insight:

We take for granted that a map is an accurate representation of the Earth, but we cannot forget that every map at a global scales has some distortions. 

Tags: map projections.

Oral History and September 11th

Seth Dixon‘s insight:

This lesson plan from the Choices Program will:

  • Explore the human dimension of the September 11 attacks by conducting an interview.
  • Consider the benefits and limitations of using oral history to learn about the past.
  • Assess their own views on September 11th.

See on www.choices.edu

These Interactive Maps Compare 19th Century American Cities to Today

” The Smithsonian Magazine recently dipped into David Rumsey‘s collection of over 150,000 maps to find some of the best representations of American cities over the past couple hundred years. With some simple programming, they were able to overlay images of vintage maps of some major cities onto satellite images from today. The results are fascinating.”

Seth Dixon‘s insight:

The ‘spyglass’ feature gives these gorgeous vintage maps a modern facelift. The cities that are in this set of interactive maps are:

Tags: cartography, mapping, visualization, urban, historical.

See on gizmodo.com

Follow the Things

followthethings_logo
“Who makes the things that we buy?  Few of us know. They seem untouched by human hands. Occasionally there’s a news story, a documentary film, or an artwork showing the hidden ingredients in our coffee, t-shirts, or iPads. They often ‘expose’ unpleasant working conditions to encourage more ‘ethical’ consumer or corporate behaviour. followthethings.com is this work’s ‘online store’. Here you can find out who has followed what, why and how; the techniques used to ‘grab’ its audiences; the discussions and impacts that this has provoked; and how to follow things yourself.”


Seth Dixon‘s insight:

Where did your T-Shirt come from?   Where did the food your parents bought at the grocery store come from?  What’s the origin of the components in your cell phone?  These questions all allude to what geographers call a commodity chain analysis.  Analyzing where the consumer goods that we use every day came from can make global issues hit a little closer to home and reinforce concepts such as globalization. The website Follow the Things is a great resource for teaching students about commodity chains and mapping out your own personal geographies.


Tags: industry, economic, globalization, consumption.

See on iwanttodiscussthat.files.wordpress.com

Regional slang words

How many of these 107 regional slang words do you use?  This week on Mental Floss’ YouTube information session, author and vlogger John Green explains 107 slang words specific to certain regions.

Seth Dixon‘s insight:

This video is a great audio supplement to these maps that display regional variations of vocabulary terms. 

Tags: language, North America, regions, USA.

See on now.msn.com

Pass Atlas: A Map of Where NFL Quarterbacks Throw the Ball

All_NFL_Passes_1152

“Football’s analytics are evolving quickly. Thanks to new forms of data and emerging kinds of analyses, teams, media, and fans are gaining new insights into on-field performances.”

Seth Dixon‘s insight:

The more advanced metrics in sports are now spatial: analyzing where on the field a particular play is more likely to be successful.  Conversely, scouting out opponents relies on detecting if a player has spatial tendencies on the court or field that might be exploited (for example, where is LeBron’s sweet spot on the court?).  This ESPN article shows how different teams and quarterbacks use the field in their offense schemes.  Increasingly, many professions are embracing the power of spatial data and spatial thinking.  

Tag: sportspatial.

See on www.grantland.com

grant_MostPassesByZone_1152

Blog at WordPress.com.

Up ↑