Source: www.bbc.com

Ninety percent of Tibetans share a genetic mutation that prevents their blood from becoming dangerously clogged with red blood cells at high altitudes—a response that can be deadly for non-native mountaineers. Karen Hopkin reports.
Source: www.scientificamerican.com
Genetic adaptations to a specific environment show how people are can be culturally and environmentally tied to a given land. While most geographers are nervous to mention examples such as these for fear of being labeled too ‘environmentally deterministic,’ it does not hurt to show how that it is possible.

In this interview with a geographer, Emily White tells us it’s more than state capitals and shares how math can help kids and parents map and explore the world.
Source: bedtimemath.org
There are plenty of reasons why it is great to be a geographer–a geographer is often a great member of an interdisciplinary research team.
How lopsided the the proportions of an urban street corner really are.
Most roads in the US are built for cars, not for pedestrians. Whether we’re happy or unhappy with this, most of us are aware of it.
But this brilliant illustration, made by Swedish artist Karl Jilg and commissioned by the Swedish Road Administration, shows just how extreme the situation truly is — even in an urban business district that’s designed with pedestrians in mind.
Tags: urban, transportation, planning, art.
Source: www.vox.com
Source: arcgis.mla.org
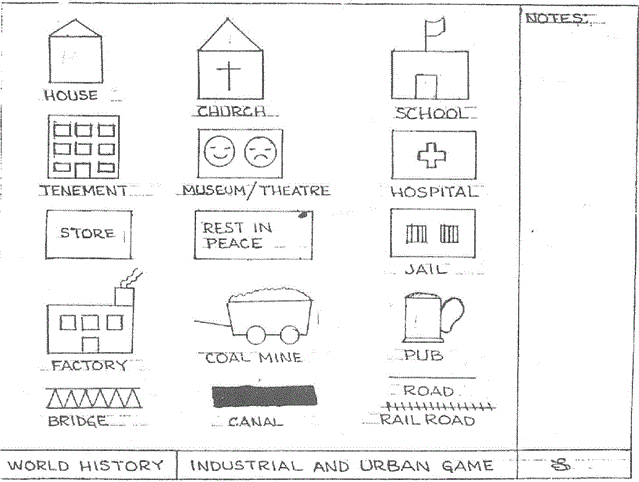
“Each student should have a large piece of butcher block paper (15×20). They should use a pencil for this activity (color pencils are optional).Using the template provided, each student should make their own template. It is crucial that size for each of the ‘characters’ in the city be the same. As you read each of the Rounds, your pace should increase so that by Round 15 the students will only have a short time to draw their buildings.”
Source: www.thecaveonline.com
In this game, you simulate the industrial revolution and have your students design a village that, after 20 rounds of the simulation, will grow to a full-fledged city. Various teachers have adapted the rules for this game and here are some variants that are saved as a standard webpage, Microsoft Word file, PDF, Powerpoint and Prezi formats.
How do you see it? http://theflatearthsociety.org/cms/ http://www.tfes.org/
Source: www.youtube.com
DISCLAIMER THAT I WISH I DIDN’T HAVE TO MAKE: I don’t believe in the flat Earth theory and think that this video is total jibberish; but it is delightfully inaccurate! This is a good way to get students to think critically about epistemology (how we know what we know) and defend their own world view. This also helps students to assess the validity of online sources.
Tags: social media.
Animation from http://earth.nullschool.net – windspeed at 10 hPa (about ~26500m / ~87000 feet above sea level)
Source: www.youtube.com
Maps have always been a source of fascination and intrigue. Today’s maps, however, can also help to save lives during disasters, document human rights abuses and monitor elections in countries under repressive rule. This presentation will explain how today’s live maps can combine crowds and clouds to drive social change.
Source: www.youtube.com
On this Thanksgiving, I want to remind this community that geospatial skills can be used to help others. Want to see geographic knowledge and geospatial skills in action? Crowd-sourced mapping is increasingly an important resource during an emergency. Poorer places are often not as well mapped out by the commercial cartographic organizations and these are oftentimes the places that are hardest hit by natural disasters. Relief agencies depend on mapping platforms to handle the logistics of administering aid and assessing the extent of the damage and rely on these crowd-sourced data sets made by people like you and me.