Search

GEOGRAPHY EDUCATION

Supporting geography educators everywhere with current digital resources.

Why Almost Nobody Lives In Most Of Canada

“Canada: land-wise, it’s one of the world’s biggest countries, but population-wise, it’s anything but.The map comes from the Government of Canada’s ‘Plant Hardiness Site,’ which contains images showing ‘Extreme Minimum Temperature Zones’ throughout the Great White North.”

TagsCanada, map, North America, weather and climate.

Source: www.huffingtonpost.ca

Megacities Interactives

“By 2025, the developing world, as we understand it now, will be home to 29 megacities. We explore the latest UN estimates and forecasts on the growth of these ‘cities on steroids’, and take a look at the challenges and opportunities megacities present for the tens of millions living in Lagos, Mexico City and Dhaka.”

Source: www.theguardian.com

Through this BBC interactive mapping feature with rich call-out boxes, the reader can explore the latest UN estimates and forecasts on the growth of megacities (urban areas with over 10 million residents).  These ‘cities on steroids’ have been growing tremendously since the 1950s and present a unique set of geographic challenges and opportunities for their residents.   Also, this Smithsonian Magazine interactive (also on the rise of Megacities), argues that dealing with megacities is one of the traits of the Anthropocene. 

Download the BBC data as a CSV file to be able to import this into a customizable ArcGIS online map.  This will help you to create an analytical storymap (but I still enjoy a good narrative storymap).  

Tags: urban, megacitiesESRI, anthropocene, CSV.

The Science of Earthquakes by Weather Underground

From fault types to the Ring of Fire to hydraulic fracking, the Earthquakes infographic by Weather Underground helps us understand the complexities of what shakes the ground.

Tags: disasters, geomorphology, physical, infographic.

Source: www.wunderground.com

The Literary United States: A Map of the Best Book for Every State

“Two weeks ago, we published a literary map of Brooklyn, highlighting the books we felt best represented the neighborhoods in which they were set. Compiling the list of books for that map had us thinking about what it means for a story to not just be from a place, but also of it, and why it is that some places have an abundance of literary riches (we’re looking at you, American South), while others, well, don’t. There are those stories that so beautifully evoke a time and a place and a way of life that it becomes close to impossible to separate the literary perception of a place from its reality—one winds up informing the other.  All [books on this states list] are literary in voice and spirit; every last one will let you understand a time and place in a more profound way than you maybe thought possible.


TagsEnglish.

Source: www.bkmag.com

Waging War Against Global Food Waste

National Geographic Emerging Explorer Tristram Stuart wants the world to stop throwing away so much good food.

Source: news.nationalgeographic.com

No one should be surprised that more developed societies are more wasteful societies.  It is not just personal wasting of food at the house and restaurants that are the problem.  Perfectly edible food is thrown out due to size (smaller than standards but perfectly normal), cosmetics (Bananas that are shaped ‘funny’) and costumer preference (discarded bread crust).  This is an intriguing perceptive on our consumptive culture, but it also is helpful in framing issues such as sustainability and human and environmental interactions in a technologically advanced societies that are often removed form the land where the food they eat originates.   You can hear more about Tristram’s work in this TED talk

Tags: food, agriculture, consumption, sustainability, unit 5 agriculture.

Baltimore’s painted screens

“Jan Crawford explores a unique folk art tradition going back 100 years – once seen on nearly every row house in the working class neighborhoods of Baltimore, as artists today once again embrace the tradition of painted window screens, an authentic connection to the city’s past.”

Source: www.youtube.com

This is tremendous example of an urban cultural landscape that is distinctive to a certain place (Baltimore) and a particular time period.  The practice of painting landscape scene on window screens began over 100 years ago, as a way to beat the heat, but still afford some form of privacy.  This aesthetic emerged out of particular set of cultural, technological, and economic factors. What was once common is now perceived as a folk art that is a worth preserving because it is a marker of the local heritage.  This is an excellent example to demonstrate a sense of place that can develop within a community.  This video has been added to my ESRI StoryMap that spatially organizes place-based videos for the geography classroom (68 and counting).   

Tags: place, landscapeart, folk cultures, videoculture, community.

Pumpkin Geography

“During the month of October, I take advantage of the pumpkin harvest to bring hands-on geography to my students.  After spending a month becoming familiar with the location of the seven continents and the major bodies of water, each student is given a pumpkin to turn into a globe. Students paint the entire surface of the pumpkin blue to represent water. Next, they use pushpins to position and trace the outline of each continent onto their pumpkins. They use actual globes as models and are careful to place the continents in the correct hemisphere. Then, they paint and label each continent a different color. They label the major bodies of water and use white paint to represent the North and South Poles.”

Source: www.nea.org

Happy October everyone!  The pictures above (from a friend’s website) show how teachers and parents alike can get children involved in a fun craft that will strengthen kids’ mental maps–all with a seasonal twist.  If you really love idea of pumpkin globes, you should also see this one.   

Tagsart, K12, fun, seasonal.

Speaking the “Language” of Spatial Analysis via Story Maps

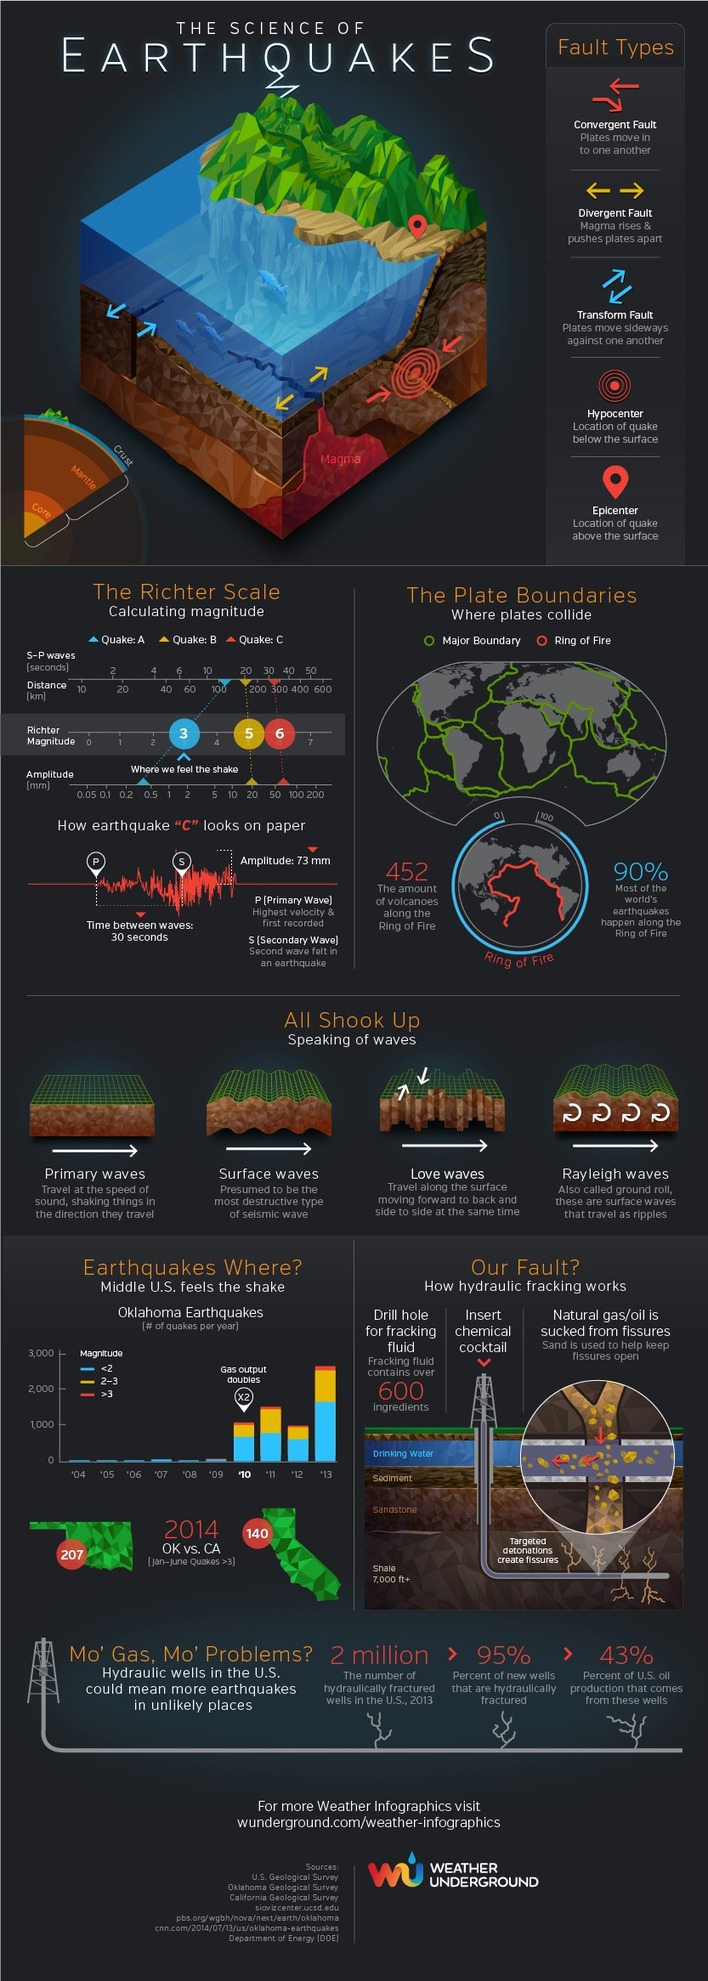
“Spatial analysis has always been a hallmark of GIS, the ‘numerical recipes’ which set GIS apart from other forms of computerized visualization and information management. With GIS we pose questions and derive results using a wide array of analytical tools to help us understand and compare places, determine how places are related, find the best locations and paths, detect and quantify patterns, and even to make spatial predictions.”

Source: blogs.esri.com

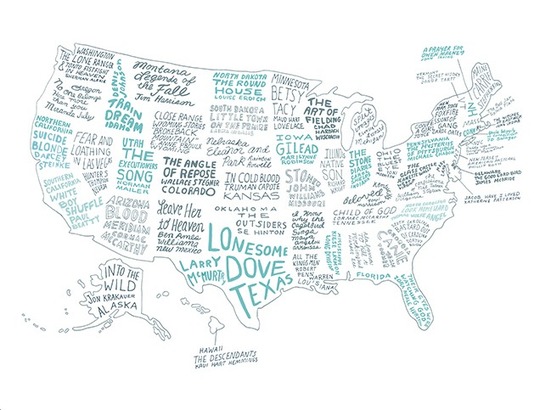
GIS is a key tool in spatial analysis, but it can also be a driving force in using math, science, technology and (yes) geography as interdisciplinary ways of teaching the curriculum.  StoryMaps can be rich with images and videos, but also filled with data at a variety of scales.  What stories can you tell in this rich, visual format?  What visual template shown might lend itself best for that sort of project? 

Tagsmapping, CSV, GISESRIgeography education, geospatial, edtech.

Aboard a Cargo Colossus

The world’s biggest container ships, longer than the Eiffel Tower is high, are a symbol of an increasingly global marketplace. But they also face strong economic headwinds.

Source: www.nytimes.com

This article and video from the NY Times is a great way to show the magnitude of the largest vessels that drive the global economy. These containers are symbols of global commerce that enable economies of scale to be profitable and the outsourcing of so many manufacturing jobs to developing countries.  The invention of these containers have changed the geography of global shipping and today the vast majority of the world’s largest ports are now in East Asia.  Today though, the biggest container ships are too big to go through the Panama Canal, encouraging China to build a larger canal through Nicaragua.      

Create a free website or blog at WordPress.com.

Up ↑