Search

GEOGRAPHY EDUCATION

Supporting geography educators everywhere with current digital resources.

What Does Earth Look Like?

Source: www.youtube.com

This video covers various topics important to mapping and satellite imagery (and a lesson from an APHG teacher on how to use this video with other resources).  There is so much more to the world and space than what we can see see.  Chromoscope, referenced in the video, simulates other forms of energy on the electromagnetic spectrum besides just visible light.  This type of information is at the core of the science behind all of our satellite imagery.  This video also covers many map projection issues and highlights online resources to understand map distortion including:


Tags: mapping, perspective, images, remote sensing, geospatial, unit 1 Geoprinciples.

Animated GIFs of Earth Over Time

“It took the folks at Google to upgrade these choppy visual sequences from crude flip-book quality to true video footage. With the help of massive amounts of computer muscle, they have scrubbed away cloud cover, filled in missing pixels, digitally stitched puzzle-piece pictures together, until the growing, thriving, sometimes dying planet is revealed in all its dynamic churn. The images are striking not just because of their vast sweep of geography and time but also because of their staggering detail.”

Source: plus.google.com

This interactive feature shows time lapse satellite imagery of some selected locations that have experienced rapid environmental change in the last few decades (or you can simply watch the animated GIFs).  These images are a way to show the power of remotely sensed data as well as massive environmental impact of rapid urbanization and globalization and the feature allows students to explore these places on their own.   

Tags: remote sensing, time lapse, land use, environment, geospatial, environment modify,  urban ecology.

A wide-angle view of fragile Earth

In this image-filled talk, Yann Arthus-Bertrand displays his three most recent projects on humanity and our habitat — stunning aerial photographs in his series “The Earth From Above,” personal interviews from around the globe featured in his web project “6 billion Others,” and his soon-to-be-released movie, “Home,” which documents human impact on the environment through breathtaking video.

Source: www.ted.com

I’ve linked galleries of the artistic, aerial photography of Yann Arthus-Bertrand several times before.  In this Ted Talk, you can hear what motivates his artistic vision and the global perspectives that he wants to bring to the fore.  You can also watch the 90-minute video ‘Home’ that he discusses in the talk here.    


Tags: images, art, worldwide, TED, environment, video.

Topography of Religion

“The Pew survey sorts people into major groupings–Christians; other religions, including Jewish and Muslim; and ‘unaffiliated,’ which includes atheist, agnostic and ‘nothing in particular.’  Roll your cursor over the map to see how faiths and traditions break down by state.”

Source: usatoday30.usatoday.com

This is a particularly useful interactive map with a lot of teaching applications.  It is a nice visual aid to process the religious data in the United States.  

Questions to Ponder: What patterns do you notice?  Are there religious regions that could be drawn based on this data?   What geographic factors have created the differences in the religious geographies of the United States?

Tags: culture, religion, Christianity, USA. regions, diffusion, mapping.

Amsterdam City: a City as Urban Statistics

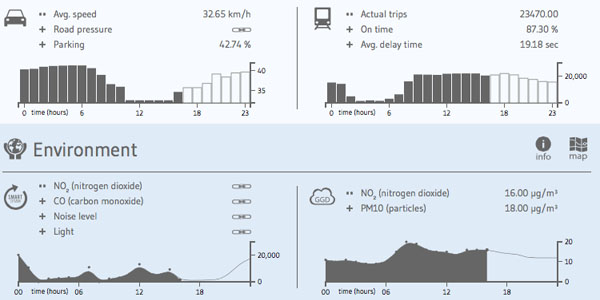
“Amsterdam City Dashboard presents the city of Amsterdam through the lens of data, including demographic statistics, traffic reports, noise readings or political messages.

The small collection of information graphics are divided in distinct domains, such as transport, environment, statistics, economy, social, cultural and security. All data is shown in near real-time, based on blocks of 24 hours. Larger dots and darker colors symbolize higher values, whereas an interactive map provides a geographic reference.”

Tags: Netherlands, urban, statistics, urban ecology, transportation, planning.

Source: infosthetics.com

EU debates biopiracy law to protect indigenous people

Pharmaceutical companies would need to compensate indigenous people for using their knowhow in creating new medicines

Source: www.theguardian.com

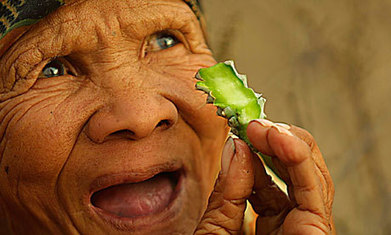
I’d never hear the term biopiracy before this month, but this idea is this: companies from wealthy countries commercially develop the genetic resources of developing countries with local assistance but don’t fairly compensate the local population.  I never had the vocabulary to describe such a thing, but that is biopiracy in a nutshell and the EU is working to end that.  It doesn’t only impact the pharmaceutical companies but heavily impact the agricultural industries as well.  Anyone in the developed world eating quinoa and kale 20 years ago?  Being marketed as ‘superfoods’ has changed the global production systems but also impacted local indigenous food supplies (some are referring to this as food gentrification). 

Tags: food production, technology, industry, food, agriculture, agribusiness, globalization, folk cultures, indigenous.

Welcome To Geography!

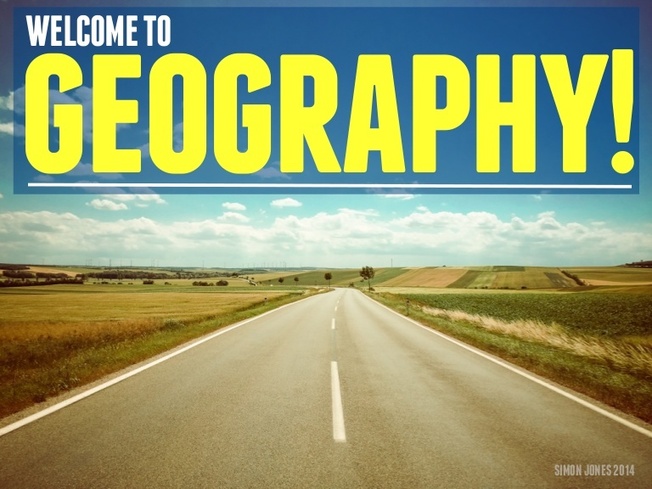
“Lets start off the new school year in style! This is a re-imagining of an older resource designed to introduce the subject to new students in a highly visual manner.  Feel free to use & share it.”

Source: www.slideshare.net

Admit it…geographers have to sell geography.  This geography teacher has done a fabulous job of demonstrating what geography is in an engaging, relevant way to start the year off right. 

Tags: geo-inspiration, geography education.


Worst Hurricane

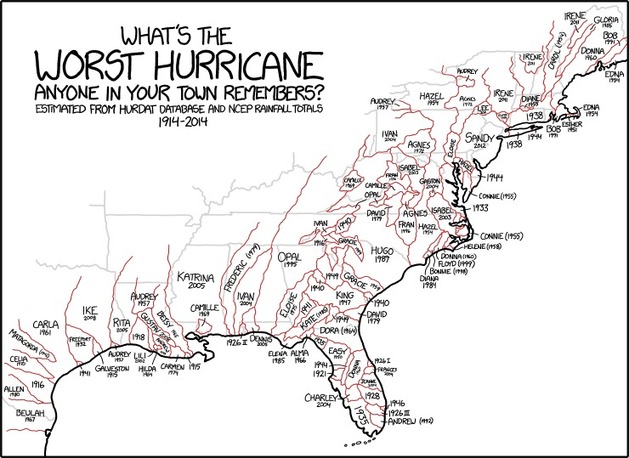
“What’s the worst Hurricane anyone in your town remembers?””

Source: xkcd.com

Click here to see a higher resolution version of this map (don’t dismiss it as just a cartoon!).  

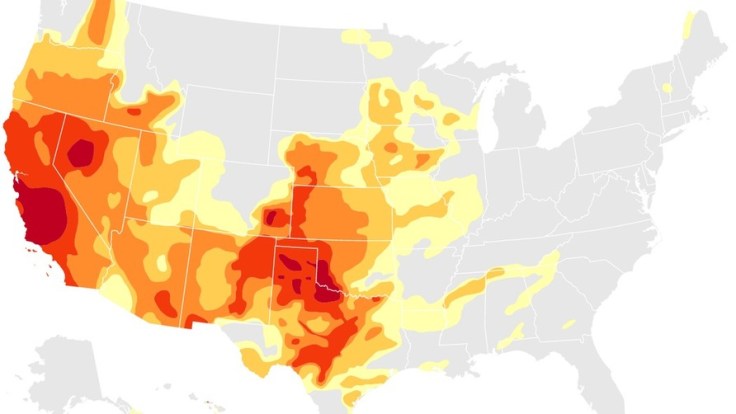
Mapping the Spread of Drought Across the U.S.

Maps and charts updated weekly show the latest extent of the drought in the United States.

Source: www.nytimes.com

I’ve shared numerous links here about the drought situation in California over the past few months, but the situation extends far beyond California as these animated maps and charts demonstrate. Some of the best public data on drought can be found at the National Drought Mitigation Center. 

Tags: water, agriculture, environment, resources, environment depend, physical, weather and climate, consumption, California.

Blog at WordPress.com.

Up ↑