Search

GEOGRAPHY EDUCATION

Supporting geography educators everywhere with current digital resources.

12 Data visualizations that illustrate poverty’s biggest challenges

See on Scoop.it – Geography Education

Want to learn more about the issues surrounding poverty in the world today? We ve assembled a collection of some of the best data visualizations for just that.

Seth Dixon‘s insight:

This set of 12 graphics all show a particular facet on the topic of global poverty.  I’ve shared some of this before, but the compilation is definitely helpful.  In the graphic above, the connection between low female literacy rates and poverty is demonstrated quite powerfully.    


Tags: poverty, development, economic, visualization.

See on www.one.org

Portraits of people living on a dollar a day

See on Scoop.it – Geography Education

“More than a billion people around the world subsist on a dollar a day, or less. The reasons differ but the day-to-day hardship of their lives are very similar. A book by Thomas A Nazario, founder of the International Organisation, documents the circumstances of those living in extreme poverty across the globe, accompanied by photographs from Pulitzer prizewinner Renée C Byer. Living On A Dollar a Day is published by Quantuck Lane.”

Seth Dixon‘s insight:

Extreme poverty is defined by the World Bank living on under $1.25 per day.  The geography of of extreme poverty highly uneven–two thirds of the extremely poor live in just 5 countries (India, China, Nigeria, Bangladesh and DR Congo).  This photogallery seeks to to show the daily life and realities of those living in extreme poverty.  This article from the Guardian argues that development should measured in human rights gains more than economic advancements. 

Tags: poverty, images, development, economic, perspective.

See on www.theguardian.com

The U.S. Cities That Sprawled the Most (and Least) Between 2000 and 2010

See on Scoop.it – Geography Education

Two maps and six charts take sprawl rankings to another level.

Seth Dixon‘s insight:

One of the great results of the decennial census is that geographers, demographers, sociologists, urbanists and countless others, can track the same population or spatial pattern and note historical changes over a 10 year span.  This series of maps and charts highlights some of the major changes.  You shouldn’t be surprised that Atlanta is the United States’ most sprawling major city and that San Francisco is the most compact, but this article dives beneath surface in a way that is still very accessible.   


Tags:  urban, unit 7 cities, housing, sprawl, neighborhood,  planning, density, planning. 

See on www.citylab.com

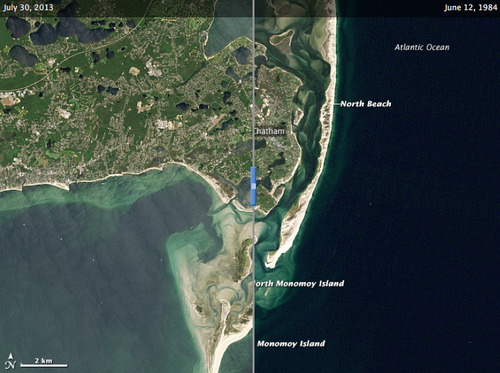
Changes on the Cape Cod Coastline

See on Scoop.it – Geography Education

Beaches are dynamic, living landscapes. The coast off of Chatham, Massachusetts, provides a prime example of beach evolution.

Seth Dixon‘s insight:

To quote coastal geologist Robert Oldale, “Many people view coastal erosion as a problem that needs to be addressed and, if possible, prevented.  However, storm and wave erosion along the shore of Cape Cod has been going on for thousands of years and will likely continue for thousands of years more. It is a natural process that allows the Cape to adjust to rising sea level. Erosion is only a peril to property. If we build on the shore, we must accept the fact that sooner or later coastal erosion will take the property away.”

Tags: coastal, remote sensing, mapping, erosion, landscape.

See on earthobservatory.nasa.gov

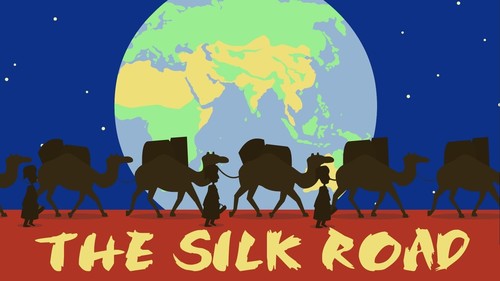
The Silk Road: Connecting the ancient world through trade

See on Scoop.it – Geography Education

“With modern technology, a global exchange of goods and ideas can happen at the click of a button. But what about 2,000 years ago? Shannon Harris Castelo unfolds the history of the 5,000-mile Silk Road, a network of multiple routes that used the common language of commerce to connect the world’s major settlements, thread by thread.”

Seth Dixon‘s insight:

This TED-ED lesson was produced in part by an AP Human Geography teacher and the strands of geographic thought in this video are evident.  More geographers should make their own TED ED lessons; thanks for blazing the trail Shannon! 


Tags: TED, worldwide, transportation, globalization, diffusion, historical, and video.

See on www.youtube.com

The Putin Factor: Russia, America and the Geopolitics of Ukraine

See on Scoop.it – Geography Education

“President Obama came into office promising a ‘reset’ in U.S.-Russia relations. Six years later, the reset, for all intents and purposes, is dead.”

Seth Dixon‘s insight:

A more informed, globally aware citizenry helps to strengthen U.S. foreign policy and diplomatic efforts; we need citizens with a spatial framework within which to organize political, environmental, cultural and economic information.  This interview with political science professor Michael McFaul is a great introduction to understanding Russia, Putin and today’s most pressing geopolitical issue.    


Tags: Russia, Ukraine, geopolitics, political.

See on www.pbs.org

Urbanization and the evolution of cities across 10,000 years


See on Scoop.it – Geography Education

“About 10,000 years ago, hunter-gatherers, aided by rudimentary agriculture, moved to semi-permanent villages and never looked back. With further developments came food surpluses, leading to commerce, specialization and, many years later with the Industrial Revolution, the modern city. Vance Kite plots our urban past and how we can expect future cities to adapt to our growing populations.”

Seth Dixon‘s insight:

This TED-ED lesson briefly summarizes the history of urban development and the technological advances that enable it.  Towards the end of the video they offer some suggestions that would make cities more sustainable as urban populations continue to grow.  What do you think of these suggestions?  

Tags: historical, urban, planning, TED. 

See on www.youtube.com

Disruptive Demographics

Disruptive Demographics (James H. Johnson Jr, June 2013) from National Entrepreneur Center on Vimeo.

  Last night I had the pleasure of attending a tremendously entertaining and incredibly informative professional development evening at the APHG reading (that isn’t an easy combination to pull of either, and he did marvelously). Dr. James Johnson is a trained geographer teaching in the School of Business at the University of North Carolina.  His talk, entitled “Disruptive Demographics: Implications for Global Competitiveness” (PDF file available here) follows in a tradition of superb presentation at the reading; in 2012, Roger Downs gave a great professional development presentation on geographic expertise. 


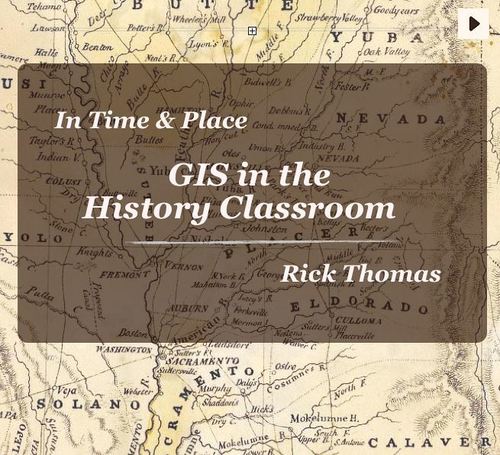
GIS in the History Classroom

See on Scoop.it – Geography Education

“I have had a number of requests for copies of GIS in the History Classroom in a format other than iBooks. I have just completed an internet version of the book that works on Safari, Firefox, Chrome, and Internet Explorer.”

Seth Dixon‘s insight:

GIS is not just for geography classes; spatial thinking and spatial data management can help students learn a variety of subjects including history.  This free ebook will help history teachers to see how to unlock the power of Geographic Information Systems. 

Tags: mapping, historical, GIS, geospatial, edtech.

See on www.intimeandplace.org

Create a free website or blog at WordPress.com.

Up ↑