Search

GEOGRAPHY EDUCATION

Supporting geography educators everywhere with current digital resources.

The Deadliest Animal in the World

See on Scoop.itGeography Education

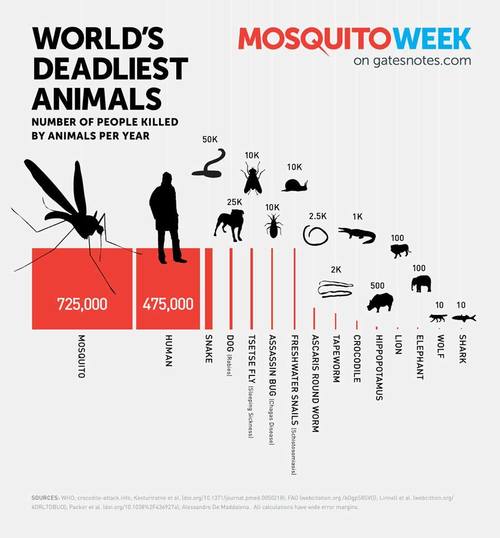
Bill Gates introduces Mosquito Week on his personal blog, the Gates Notes. Everything posted this week is dedicated to this deadly creature. Mosquitoes carry devastating diseases like malaria, dengue fever, yellow fever, and encephalitis.

Seth Dixon‘s insight:

We might be more terrified of large-bodied predators, but mosquitoes are the main vector of some deadly diseases.  Mosquitoes kill more people in 4 minutes that sharks do in an entire year.  The distribution of mosquitoes is a critical component in the geography of development.  This isn’t just a nuisance; it’s a matter of life or death.  

Tags: medical, development.

See on www.gatesnotes.com

News Literacy: Critical-Thinking Skills for the 21st Century

See on Scoop.itGeography Education

“Every teacher I’ve worked with over the last five years recalls two kinds of digital experiences with students.The first I think of as digital native moments, when a student uses a piece of technology with almost eerie intuitiveness. The second I call digital naiveté moments, when a student trusts a source of information that is obviously unreliable. How can these coexist? How can students be so technologically savvy while also displaying their lack of basic skills for navigating the digital world?”

Seth Dixon‘s insight:

This is a nice article with some practical advice but it also can that helps us conceptualize the thinking skills that our students are going to need in the future(with a classic photo that embodies 20th century news literacy).  Previously, I’ve written on this same topic, with some strategies to how to help students assess the validity of online information with geographic content (with a series of maps and images).  I know I’ve been duped before, and it’s okay to admit that to your students; but we need to teach students how to be critical readers as they are swimming in an ocean of digital information of variable quality.  This is why I see content curation as an important part of modern education; it is a way to teach student the tools to assess the quality of information for themselves.  They will be gathering, organizing and synthesizing digital information for rest of their lives.        

See on www.edutopia.org

Here are three of Russia’s military options in Ukraine, complete with maps

See on Scoop.itGeography Education

There have been a number of warnings from Kiev and Washington about the possibility of a direct and open Russian military intervention in Ukraine. But what could that look like?

Seth Dixon‘s insight:

I’m not saying any of these 3 scenarios are going to happen nor am I endorsing them either.  That said, this article/podcast provides a geopolitical analysis (with maps) of Russia’s potential military options if they are planning on invading Ukraine. 

See on www.pri.org

What you’d need to make in every county in America to afford a decent one-bedroom

See on Scoop.itGeography Education

“The National Low Income Housing Coalition took those fair market rents and calculated how much a worker would have to earn per hour to cover such modest housing, if we assume a 40-hour work week and a 52-week year. They call this rate a “housing wage,” and it is, unsurprisingly, much higher than the minimum wage in much of the country.”

Seth Dixon‘s insight:

This article on the economic geography of housing is supplemented by this interactive map with county-level data. There are a lot of conversations that could stem from an analysis of this data.  Where are the housing prices highest?  How come?  This is a resource that could allow students to explore the economic geography of their own region and apply that local knowledge to understand processes throughout the United States.   

Tags:  housingsocioeconomic, urban, planning, unit 7 cities.

See on www.washingtonpost.com

Secretary Kerry Delivers Remarks on Ukraine


“U.S. Secretary of State John Kerry deliver remarks on Ukraine at the U.S. Department of State in Washington, DC on April 24, 2014. A transcript is available here.”

Seth Dixon‘s insight:

If you want to understand the U.S. government’s official stance and perspective on the escalating geopolitical tensions between Ukraine and Russia, this speech is a good place to start.  The U.S. government doesn’t want to forget that Crimea is already occupied by Russia and the short video below expands the U.S. perspective on the reasons behind the crisis.

Tag: Ukraine, political, conflict.

Nine Cities That Love Their Trees

See on Scoop.itGeography Education

More and more American cities are working to preserve their trees. Here’s a look at nine cities working to conserve their tree canopies.

Seth Dixon‘s insight:

Happy Arbor Day!  Trees and vegetation play a vital role in the urban ecology of a city and many planners actively work towards creating more green infrastructure.  This National Geographic feature highlights nine cities that promote green spaces.  As I’ve mentioned before, trees are also a part of social inequities that can be seen in our urban landscapes.  The more trees there are in a neighborhood, the greater the socioeconomic standings of that community in a metropolitan area, and conversely, poverty-stricken areas usually have minimal canopy cover (thought exercise–what does this correlation mean?). 

Tagsurban ecology, biogeography, environmentecology, urban, socioeconomic, neighborhood.

See on www.nationalgeographic.com

A Map of Baseball Nation

See on Scoop.itGeography Education

“Fans may not list which team they favor on the census, but millions of them do make their preferences public on Facebook. Using aggregated data provided by the company, we were able to create an unprecedented look at the geography of baseball fandom, going down not only to the county level, as Facebook did in a nationwide map it released a few weeks ago, but also to ZIP codes.”

Seth Dixon‘s insight:

This isn’t just a fun sports map–there are some good geographic concepts that can be used here.  When discussing cultural regions, many use the core-domain-sphere model.  This map uses the brightest color intensities to represent the core regions and the lightest hues to show waning strength, but to still signify that the area is a part of a team’s sphere of influence.  Essentially, this map is begging you to explore the borderlands, the liminal “in-between” spaces that aren’t as easy to explain.  What other phenomena can be used to demonstrate the core-domain-sphere model of cultural regions?  What other geographic concepts can you teach using this map?  

Tags: fun, sport, placeborders, statistics, mapping, regions.

See on www.nytimes.com

Comparing Rhode Island’s Size

See on Scoop.itGeography Education

“I recently received this incredible shirt (I think the Easter bunny must stalk my Facebook page…but the shirt is also available online here).  I loved the idea behind it; the T-shirt mingles big-state bravado that declared regional superiority, with small-state insecurity that begs not forgotten. Both sentiments, even if they are on opposite side of the spectrum, display an enormous sense of regional pride, communal identity.” 

Seth Dixon‘s insight:

My first thought was to check the truthfulness of this map and to see how many “Rhode Islands” there are in state Texas.  I used this clever website that shows the number of areal units equal to the size of Rhode Island that are in any given country. And despite what that southwest bravado may lead you to believe, Texas isn’t its own country. So I needed to find a different website which lets you overlay any two places one on top of the other. This is a fantastic resource for help leverage your students’ local knowledge to teach them about places that are more remote and where their mental maps might have very little data.   And never mess with the Ocean State…even if this is Texas’ version of Earth Day.

See on rigea.org

The Geography of Small Talk

See on Scoop.itGeography Education

Surprising alternatives to “so what do you do?”—from New Orleans to New York.

Seth Dixon‘s insight:

The types of questions that you ask when you are meeting someone new for the first time has some regional variations but there is much more to the geography of small talk than that as see in this 4 minute video.  People want to understand your cultural, ethnic, socioeconomic context by asking spatial questions about where you are from.  Identity and place are tightly woven and these neighborhood questions are almost invitations to share much more personal information, as if to ask, “how do you fit in this world?”  When you are being introduced to someone, what are the questions that you ask, and what type of information are you hoping to get?  Each person has their own little geography that has profoundly shaped who they are—so what’s your story? 


Tags: language, regions, folk cultures, communityplace, neighborhood.

See on www.theatlantic.com

Create a free website or blog at WordPress.com.

Up ↑