Search

GEOGRAPHY EDUCATION

Supporting geography educators everywhere with current digital resources.

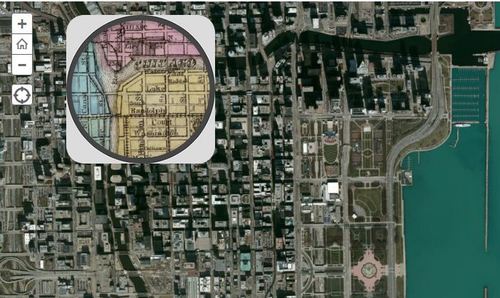
Chicago on the Eve of the Great Fire

This 1868 pocket map of Chicago shows the city in full-blown expansion, a mere 3 years before the infamous blaze

Seth Dixon‘s insight:

This interactive map with a ‘spyglass’ feature   Chicago is displaced during a economic boom period as the U.S. was expanding westward.  Where where the railroads located then?  Why have some of them vanished today?  Notice anything curious about the coastline along Lake Michigan?  Follow this link to see similar interactives of other major U.S. cities.

Tags: Chicago,  historical. 

See on www.smithsonianmag.com

World’s Hurricane Tracks

“170 Years of the World’s Hurricane Tracks on One Dark and Stormy Map.”

Seth Dixon‘s insight:

What physical forces create hurricanes?  What spatial patterns are evident? How does this map impact settlement patterns or hazard mitigation efforts? 

Tags: physical, disasters, environment,

See on www.wired.com

Thinking Green in Pittsburgh

Pittsburgh, called “hell with the lid taken off” in the 19th century because of its industrial filth, is now an academic leader in the green movement.

Seth Dixon‘s insight:

This is a great article on regional sustainability initiatives and education in the Pittsburgh area.  Given Pittsburgh’s history, that makes these clean industrial projects all the more impressive.    

See on www.pittsburghmagazine.com

Ethnic/Population Density Map

NORTHEAST

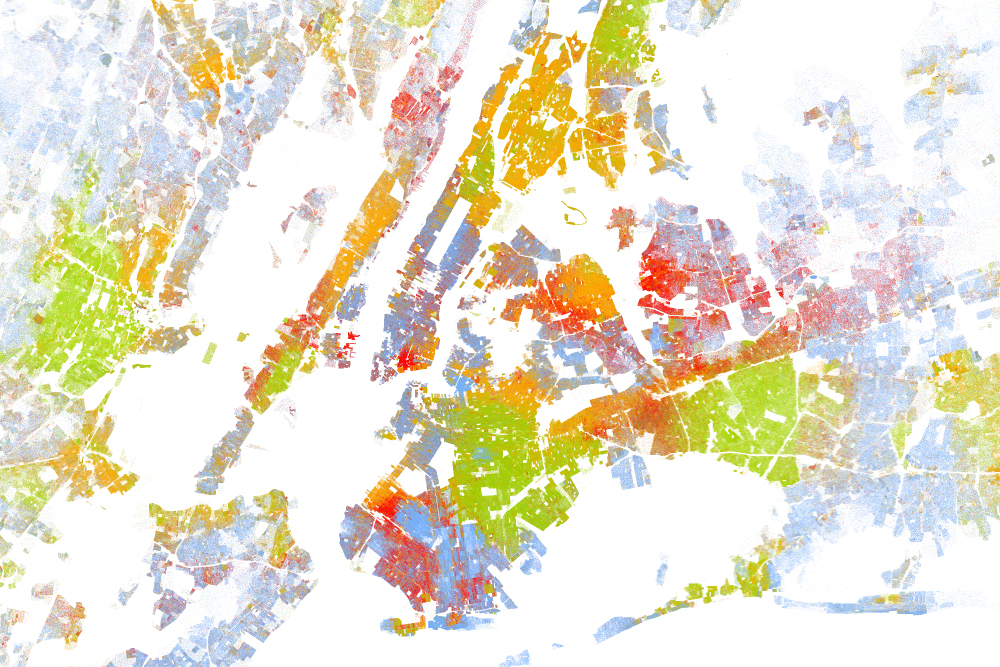
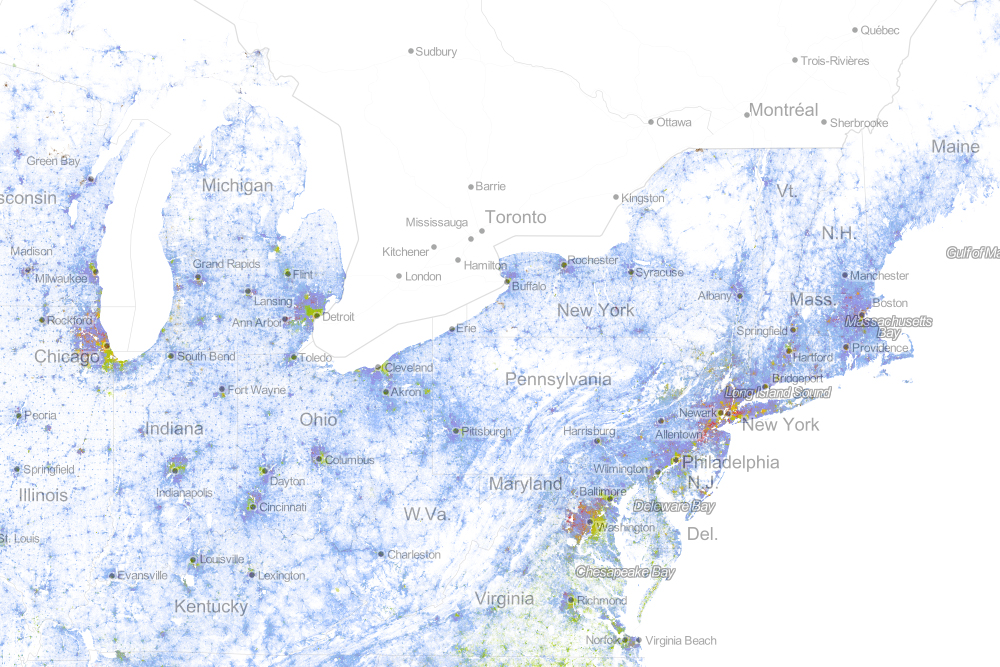
“Drawing on data from the 2010 U.S. Census, the map shows one dot per person, color-coded by race. That’s 308,745,538 dots in all.”

Seth Dixon‘s insight:

This is an incredibly gorgeous interactive map of population density in the United States.  It is very reminiscent of this North American Map with two major differences.  On the down side, Mexican and Canadian data are not displayed but on the bright side, the added color component is used to show ethnic categories as defined by the 2010 U.S. census.  Please explore this map at a variety of scales and in distinct locales.

Questions to Ponder: Is this a map of ethnic diversity patterns or is it a map of racial segregation?  How come?  Is there additional information that you would need to decide?  This review of the map on Wired described this map as a map depicting segregation: why would they say that? 

Tags: cartography, mapping, visualization, population, density, ethnicity. race.

nycnolabel

Geography/Common Core Webinar

“If you’re concerned about Common Core and how geography fits in then don’t miss this informative event. We’ll dive into resources that were designed to expand the definition of text, show the alignment between the ELA common core standards and Geography for Life along with suggesting teaching ideas. This presentation will focus on the ELA and Geography Interconnections document that was created to support educators. The session will also highlight the National Geographic Common Core website and the resources available. Join us for a look into Common Core Standards and Geography Education!”

Seth Dixon‘s insight:

NCGE and National Geographic Education have partnered to bring you the first free partnership webinar of the 2013-2014 NCGE Webinar Series!  This webinar is tomorrow evening (Wednesday August 28th, 9:00pm EDT) so register ASAP!  I’ve posted some resources in the past about how geography and the Common Core can be aligned; this webinar will pull together years of work to ensure that geography does not get squeezed out of the curriculum.  

Tags: common core, English, NCGE, National Geographic, geography education, teacher training.

See on attendee.gotowebinar.com

High School Students Interviewed

Jay Leno interviews high school students knowledge of global issues and geographic understanding…as I’m sure you can guess, it isn’t pretty.

Seth Dixon‘s insight:

If you want your students to be able to laugh at other students that aren’t actually in your classroom, Jay Leno can always find a pool of people willing to embarrass themselves in front of the camera (mocking and being mocked was a major part of my junior and high school experiences).  This and about a dozen other videos are compiled together in this start-of-the-year video list. 

See on www.youtube.com

GPS Astray: Lost in Death Valley

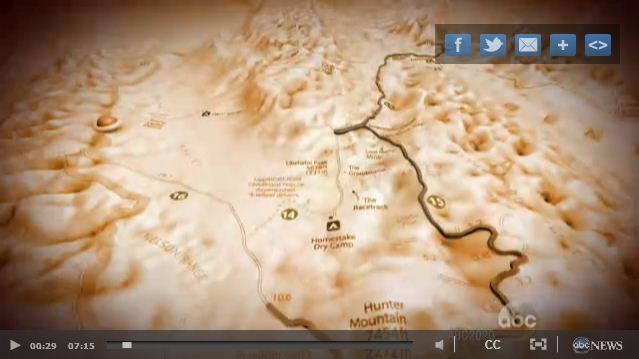
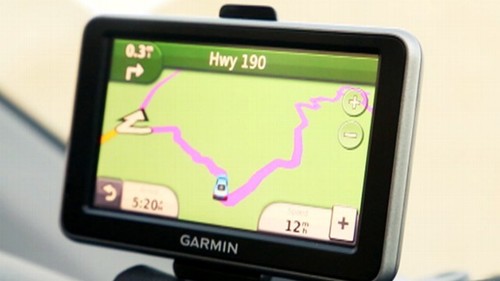
Part 1: Three women’s Death Valley day trip soured after their GPS led them to the edge of survival.

Seth Dixon‘s insight:

This is a extreme example, but this video serves as a cautionary tale.  The harsh and unforgiving physical geography of Death Valley does not tolerate a lack of preparation.  Here is part 2 of the video.  Garmin the GPS manufacturer’s statement on these videos is quite telling “GPS’s shouldn’t be followed blindly…it is incumbent on users to obtain and update their GPS devices with the most recent map updates.” 

Technology is designed to guide and assist our decision-making process–that does NOT mean we should turn over thinking functions to the device.  Spatial thinking is just like a muscle that will atrophy if it is never used.  So consult a map and think for yourself; newer technologies aren’t always better or more reliable.   

Tags: mapping, GPS, geospatial, location, California,

See on abcnews.go.com

GPS

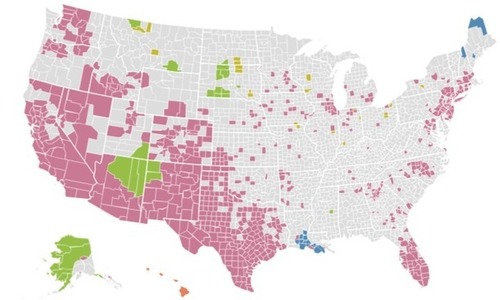
Linguistic Diversity at Home

“Counties where at least 10 percent of people speak a language other than English at home.”

Seth Dixon‘s insight:

While this is ostensibly a map that would be great for a cultural geography unit, I’m also thinking about the spatial patterns that created this map.  What current or historical migrations account for some of the patterns visible here?  What would a map like this look like it it were produced 50 years ago?  Why are Vermont and West Virginia the only states without a county with over 10% of the population that speak another language at home?  

Tags: language, North America, mapping, regions, census, migration, population, historical, folk cultures, USA.

See on www.washingtonpost.com

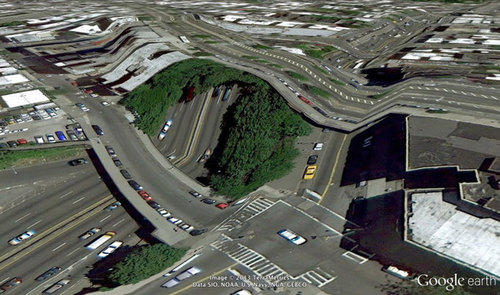
When Google Earth Goes Awry

These jarring moments expose how Google Earth works, focusing our attention on the software. They reveal a new model of representation: not through indexical photographs but through automated data collection from a myriad of different sources constantly updated and endlessly combined to create a seamless illusion; Google Earth is a database disguised as a photographic representation. These uncanny images focus our attention on that process itself, and the network of algorithms, computers, storage systems, automated cameras, maps, pilots, engineers, photographers, surveyors and map-makers that generate them.”

Seth Dixon‘s insight:

The quote above from Clement Valla shows some of the problems with trusting too completely in a form of technology if you are not sure how it works or what its limitations are.  What does he mean when he says “Google Earth is a database disguised as a photographic representation?”  What does this have to do with the term metadata?   

Tags: cartography, visualization, mapping, art, google.

See on twistedsifter.com

Blog at WordPress.com.

Up ↑