Search

GEOGRAPHY EDUCATION

Supporting geography educators everywhere with current digital resources.

Dept. of Labor’s Geospatial Data

Via Scoop.it – Geography Education
The United States Dept. of Labor has great tools for analyzing economic and industrial data for the U.S.A.  County level data is also available.  Personal favorite: you can analyze the economic viables based on industry (perfect for teaching about the various sectors of the economy). 

Via beta.bls.gov

Shanghai: 1998 vs. 2013

In the Atlantic, there was an article that highlighted some incredible comparisons of Shanghai’s Pudong district that the globalization.  The image below is my rendering of the two images as a composite image.

Reuters photographer Carlos Barria recently spent time in Shanghai, China, the fastest-growing city in the world. A week ago, he took this amazing shot, recreating the same framing and perspective as a photograph taken in 1987, showing what a difference 26 years can make. The setting is Shanghai’s financial district of Pudong, dominated by the Oriental Pearl Tower at left, and the new 125-story Shanghai Tower, China’s tallest building and the world’s second tallest skyscraper, at 632 meters (2,073 ft) high, scheduled to finish by the end of 2014. Shanghai, the largest city by population in the world, has been growing at a rate of about 10 percent a year the past 20 years, and now is home to 23.5 million people — nearly double what it was back in 1987. This entry is focused on this single photo pairing, with several ways to compare the two.

Shanghai

This additional image shows the difference from 1990-2010.

Globalization has hit…hard and fast.

Via i.imgur.com

Hiroshima after the Atomic Bomb

Via Scoop.it – Geography Education

360° panoramic photography by Harbert F. Austin Jr.. Visit us to see more amazing panoramas from Japan and thousands of other places in the world.


The interactive panorama is eerily compelling…this is a haunting image. 

Via www.360cities.net

TeachSpatial: Resources for Spatial Teaching and Learning

Via Scoop.it – Geography Education

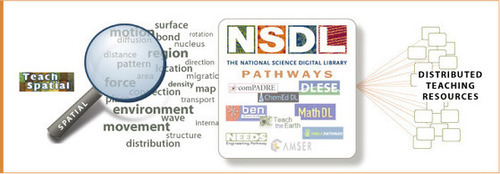
This resource is a comprehensive approach to teaching spatial thinking skills. Terms with spatial reference (i.e.-place, diffusion, migration, situation, scale, region, centrality, proximity, etc.) are defined within their spatial context and related to their multiple curricular connections such as Life Science, Physical Science, Earth Science and (of course) Geography. These terms and concepts then link you to teaching resources, online modules, lesson plans and classroom activities. While useful for all units, this is especially useful for the beginning of a course to teach the importance of spatial thinking skills to then have them permeate the rest of the year. 

Via teachspatial.org

Manufactured Landscapes

Via Scoop.it – Geography Education

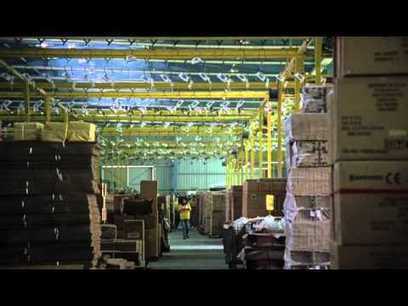
This 90 minute documentary is an often painful look and the landscapes of manufacturing and the geography of resource extraction.  This video is VERY slow, so I don’t recommend showing the whole video in class, but certain this video would be a good inclusion in a lesson (e.g.-Three Gorges Dam, e-waste or factory work).  This Zeitgeist Film by Jennifr Baichwal focuses primarily on Chinese manufacturing landscapes and the environmental impacts that technology produces that we would collectively like to pretend we can wish them away. 

Via www.youtube.com

Texas Storm Was Over Eight Miles High

Via Scoop.it – Geography Education

The astonishing power of Mother Nature….


3D NASA images show the magnitude of last week’s storm in Texas was immense, vertically towering 8 miles above the Texas landscape.  The storm “spawning 14 tornadoes and golf ball sized hail was immense…[NASA’s] Tropical Rainfall Measuring Mission (TRMM) satellite watched the storm develop and measured its cloud height at above eight miles high.” 

Via www.businessinsider.com

Where America Needs Doctors

Via Scoop.it – Geography Education

What is the geography of medical practicioners?  Why are doctors concentrated more in certain parts of the country?  “If anything, this map illustrates how much where you live matters for how much health care you have access to. The 17,000 residents of Clark County, Miss. do not have a single primary care doctor in the area. Up in Manhattan there is one doctor for every 500 people.”  Click on the link for an interactive ESRI-produced StoryMap.

Via storymaps.esri.com

Mega-Farms to Hit City Rooftops

Via Scoop.it – Geography Education

Plans for a rooftop farm are the largest in the world.


Brooklyn Grange Farm is Expanding to a 45K Square Foot Rooftop in the Brooklyn Navy Yard. This is a stunning example of urban agriculture designed to produce local food, even with limited spatial resources.  There is also a 3.5 minute video clip attached to the article. 

Via abcnews.go.com

Global Healthcare patterns

Via Scoop.it – Geography Education

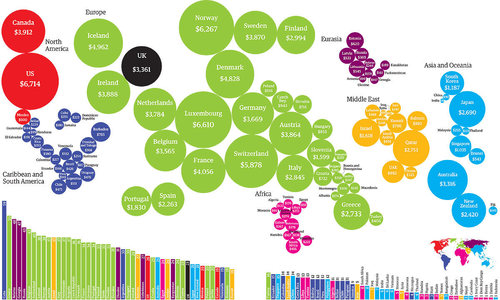
The Guardian’s health editor introduces our health factfile – and the full dataset behind it…


Discussion questions: What regional patterns are there in the per capita healthcare spending?  What connection would you expect between per capita health care spending and the quantity of doctors?  What areas spend the least on healthcare?  How come? 

Via www.guardian.co.uk

Blog at WordPress.com.

Up ↑