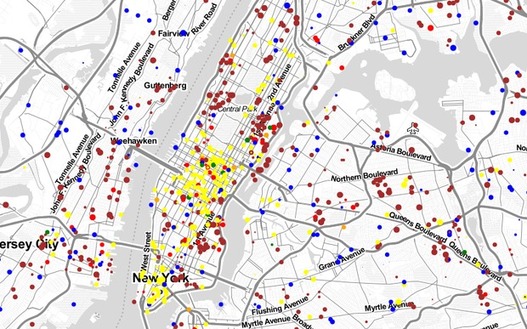
“Thanks to a nonprofit, nonpartisan project known as the Gun Violence Archive, data on gun homicides and nonfatal shootings is now available well before the federal government releases its statistics. Those data include location information that makes it possible to plot those shootings on a map showing how many have taken place in your vicinity.”
Source: www.slate.com
Perspectives of gun rights and public safety are highly divided. Part of those divisions are ideological, but there are also big differences between urban and rural America. This map of the NRA’s “report card” on the legislators of Congress shows some pretty powerful spatial patterns. This interactive map of people how have been shot this year shows a decidedly differnt pattern that the first.
Questions to Ponder: How do most people feel about the second amendment where you live? What about your local geography might influence those opinions?