Search

GEOGRAPHY EDUCATION

Supporting geography educators everywhere with current digital resources.

Tag

physical

Tornado Alley

Interested in learning about tornado alley? Then you’ll want to read our tornado alley facts and information. Tornado Alley 101

Source: www.tornadofacts.net

This map nicely shows the particular air requirements needed for a tornado to form and why the part of the United States known as Tornado Alley accounts for the majority of the world’s tornadoes.  This nicely shows how physical geographic factors form a major part of how a region might be defined and conceptualized. 


Tags: tornado, physical, weather and climate, visualization, regions.

Iceland’s Glacial Melt and Geothermal Activity

Glacial melting and flooding occurs every year by the Skafta River in Iceland. As the water travels down towards the North Atlantic Ocean, incredible patterns are created on the hillsides. Rising lava, steam vents, or newly opened hot springs can all cause this rapid ice melt, leading to a sizable release of water that picks up sediment as it flows down from the glaciers.


Tags: geomorphology, physical, Europe, fluvial, water, landforms, images.

Source: www.instagram.com

Earth Science Memes

This link is where you will find funny science pictures, jokes, current events and other miscellaneous things pertaining to science.

Source: lacrossearthscience.weebly.com

Because we all need a laugh sometimes…and if we can teach something at the same time, then even better.   


Tagsphysical, geomorphology, funart.

A Medieval Abbey Trapped by Tides and Time

“Mont Saint-Michel emerges from the tides in Normandy, France, like an ancient village from a fairytale. The coastal town built on a massive granite rock cuts a dramatic silhouette against the sky, rising from disappearing marshes to a Gothic Abbey at its height. With a permanent population of around 50, this popular tourist destination has a history dating back to at least the Roman era. Fancy a tour before the tides roll in?”

Source: www.youtube.com

Coastal physical geography produces some beautiful landforms such as tombolos.  A tombolo is created when sand deposits attach an island to a larger piece of land–think of it as special type of isthmus.  Mont St. Michel is the world’s most famous example because of the iconic walled city with crowned with a striking medieval abbey.  This is one of those fascinating places for both the human and physical geographer.   


Tags: water, physical, coastal, geomorphology, landformsFrance, historical, tourism.

The Whale’s Tail

“The Ballena Marine National Park is located in Puntarenas, at the South Pacific coast of Costa Rica.” 

Source: www.ballenainfocenter.com

This National Park in Costa Rica is a delightful example of many things geographic.  Not only is the local biogeography make this a place famous for whales (ballena in Spanish), but the physical geography also resembles a whale’s tail.  This feature is called a tombolo, where a spit connects an island or rock cluster to the mainland. Additionally, there is also a great community of citizen cartographers mapping out this park and the surrounding communities. 


Tagsbiogeography, environment, geomorphology, physicalwater, landforms.

What’s the tallest mountain on Earth?

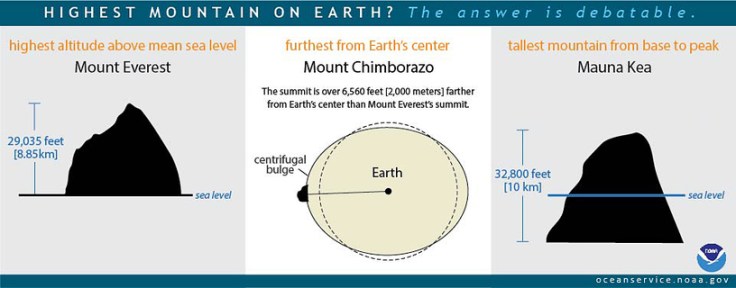
“Mount Everest is usually said to be the highest mountain on Earth. Reaching 29,035 feet at its summit, Everest is indeed the highest point above global mean sea level—the average level for the ocean surface from which elevations are measured. But the summit of Mt. Everest is not the farthest point from Earth’s center.

Earth is not a perfect sphere, but is a bit thicker at the Equator due to the centrifugal force created by the planet’s constant rotation. Because of this, the highest point above Earth’s center is the peak of Ecuador’s Mount Chimborazo, located just one degree south of the Equator where Earth’s bulge is greatest. The summit of Chimborazo is 20,564 feet above sea level. However, due to the Earth’s bulge, the summit of Chimborazo is over 6,560 feet farther from the center of the Earth than Everest’s peak. That makes Chimborazo the closest point on Earth to the stars.  

You may be surprised to learn that Everest is not the tallest mountain on Earth, either. That honor belongs to Mauna Kea, a volcano on the Big Island of Hawaii. Mauna Kea originates deep beneath the Pacific Ocean, and rises more than 32,800 feet from base to peak.”

Source: oceanservice.noaa.gov

I’ve tried to answer this question without any visual aids and there is always at least one confused look in the class.  This infographic is the most straightforward way to give the ‘long’ answer to a seemingly simple question, “what is the tallest mountain on Earth?”  It all depends on how you measure it and what your reference point is.   


Tags: physicalEcuador, Nepal.

Hurricane Matthew-Humanitarian Mapping

“The Humanitarian OpenSteetMap Team (HOT) has activated to provide geographic base data in areas affected by Hurricane Matthew. Category 4 Hurricane Matthew continues to strengthen and is advancing on Haiti and the Bahamas. Hurricane Matthew is expected to cause ‘catastrophic‘ damage including extreme flooding and landslides potentially affecting millions in Haiti, Jamaica, and Bahamas. To start we are mapping coastal communities in the storm path.”

Source: hotosm.org

Want to see geographic knowledge and geospatial skills in action?  Crowd-sourced mapping is increasingly an important resource during an emergency.  Poorer places are often not as well mapped out by the commercial cartographic organizations and these are oftentimes the places that are most vulnerable to natural disasters.  Relief agencies depend on mapping platforms to handle the logistics of administering aid and assessing the extent of the damage and rely on these crowd-sourced data sets.  My students and I are working on this over the weekend; can you join in and help?  The projects that are marked urgent by the Red Cross are all in Haiti right now.  Here are is a video playlist that explains the project and how you can help if you are new to OpenStreetMap (OSM).


Tags: disasters, mappingSTEM, physicalHaiti, weather and climate.

Why Hurricane Categories Make a Difference

During a hurricane you usually hear meteorologists refer to its intensity by categories. If you don’t know the difference between a category 1 and a category 5 hurricane, The Weather Channel meteorologist Mark Elliot breaks it down for you.

Source: www.youtube.com

With Hurricane Matthew having just hit Haiti (video) and Cuba, it now poised to strike Florida. Many are unsure what the term “category 4” actually means because they are unfamiliar with the Saffir-Simpson Hurricane Wind Scale.  This video is a good introduction to what this means to people in the path of the hurricane. As we monitor this (and future) situation, these are my favorite digital globes that display wind speeds and a few other of Earth’s physical systems. What is beautiful and majestic from one scale can be horrific and catastrophic at another:    


Tagsphysical, weather and climatedisasters, mapping, visualization.

The Tidal Waves of the Qiantang River

For hundreds of years, on the eighth month of the lunar calendar, people have gathered along the shores of China’s Qiantang River at the head of Hangzhou Bay to witness the waves of its famous bore tide. Higher-than-normal high tides push into the harbor, funneling into the river, causing a broad wave that can reach up to 30 feet high. If the waves surge over the banks, spectators can be swept up, pushed along walkways or down embankments. Below, I’ve gathered images from the past few years of the Qiantang bore tides.

Source: www.theatlantic.com

This is an amazing set of images, where a cultural phenomenon is wrapped up in observing the pulsating physical geography of the river.  Usually the tidal bore is impressive (but not dangerous–see video here), but occasionally it can be incredibly violent (see this 2015 video).   


Tags: physical, geomorphologywaterChina.

Blog at WordPress.com.

Up ↑