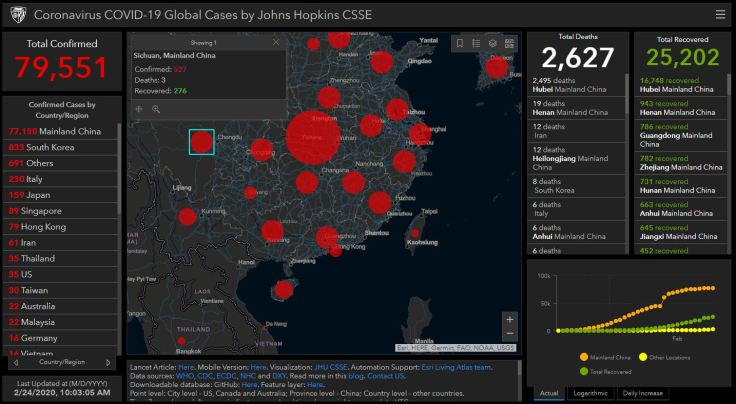
“We are tracking the COVID-19 spread in real-time on our interactive dashboard with data available for download. We are also modeling the spread of the virus.” SOURCE: GIS and DATA at Johns Hopkins University
UPDATE: ESRI has also created a GIS dashboard for the COVID-19 virus that complies an amazing amount of spatial data in a user-friendly format that is definitely worth your time. Also, this article titled “Why Geography is a Key Part of Fighting the COVID-19 Coronavirus Outbreak” is another example of that shows the importance of spatial thinking in interdisciplinary contexts.
After several inaccurate maps spread misinformation (dare I say, in a viral fashion?), I felt it would be important to not only share some good maps, but the most data-rich maps as well. Some U.S. west coast cities, such as San Francisco, are declaring emergencies in anticipation of an outbreak. The Tokyo Marathon has been cancelled (except for the elite runners), and some are worrying out loud about whether the 2020 Tokyo Olympics games might face a similar fate. This article nicely explains just how contagious the COVID-19 virus actually is…(short answer, it’s pretty contagious).
The video below covers 3 major economic impacts that the virus will have on the global economy. In short, 1-Tourism and Travel, 2-Supply Chains, and 3-Flight to Quality Goods.
My favorite source is a GIS dashboard from John Hopkins that is incredibly detailed. This is a great way to show how big data, mapping, and geography become very relevant. Here is a link to the Center of Disease Control’s (CDC) page about the Coronavirus and a copy of their map (accurate as of Feb 24) in the image below.
GeoEd Tags: medical, mapping, GIS, statistics, mortality.


Leave a comment